Staumbaugh Heller is a Democratic stronghold. About 75% of voters here vote Democratic and 25% Republican.
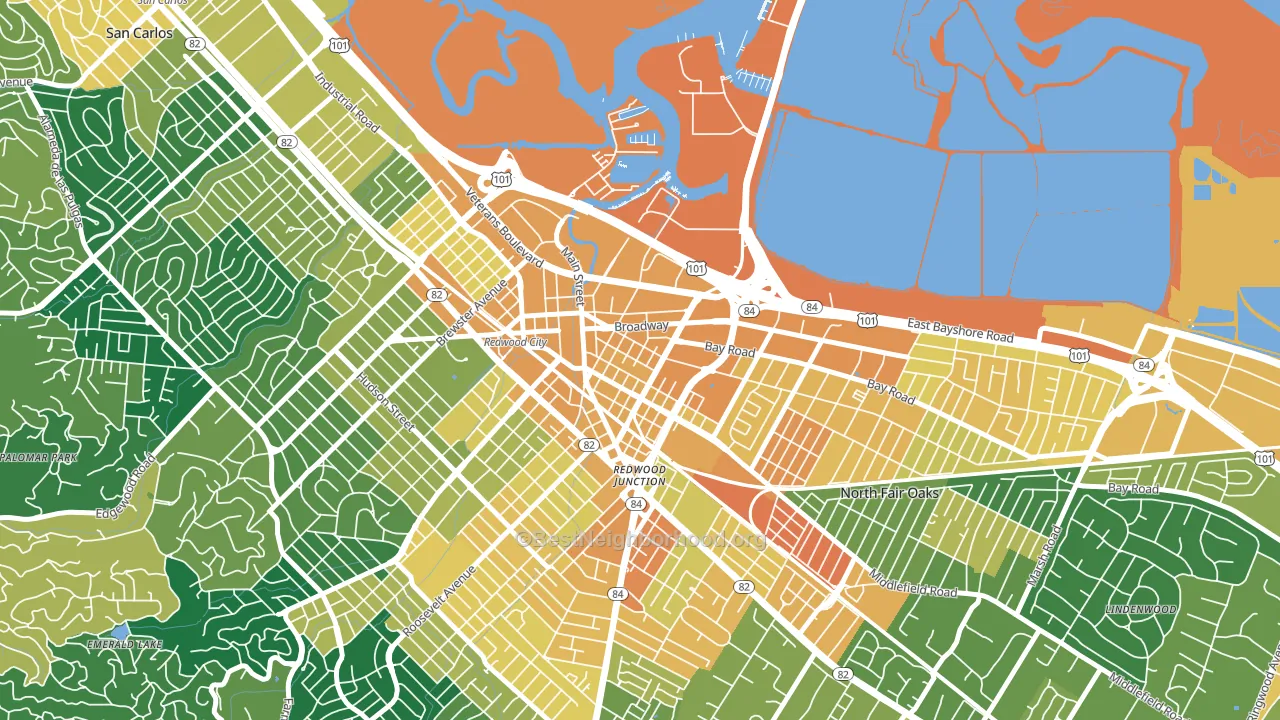
About 37% of adults in Staumbaugh Heller typically vote, below the U.S. average of about 62%. Among adults in Staumbaugh Heller, ~28% vote Democratic, ~9% Republican, and ~63% don't vote. The map below shows estimated turnout by block group.
How Staumbaugh Heller compares
Among neighborhoods within 5 miles, Staumbaugh Heller leans more Democratic than 4 of 14 neighbors.
Staumbaugh Heller runs about 31 points more Democratic than California as a whole.
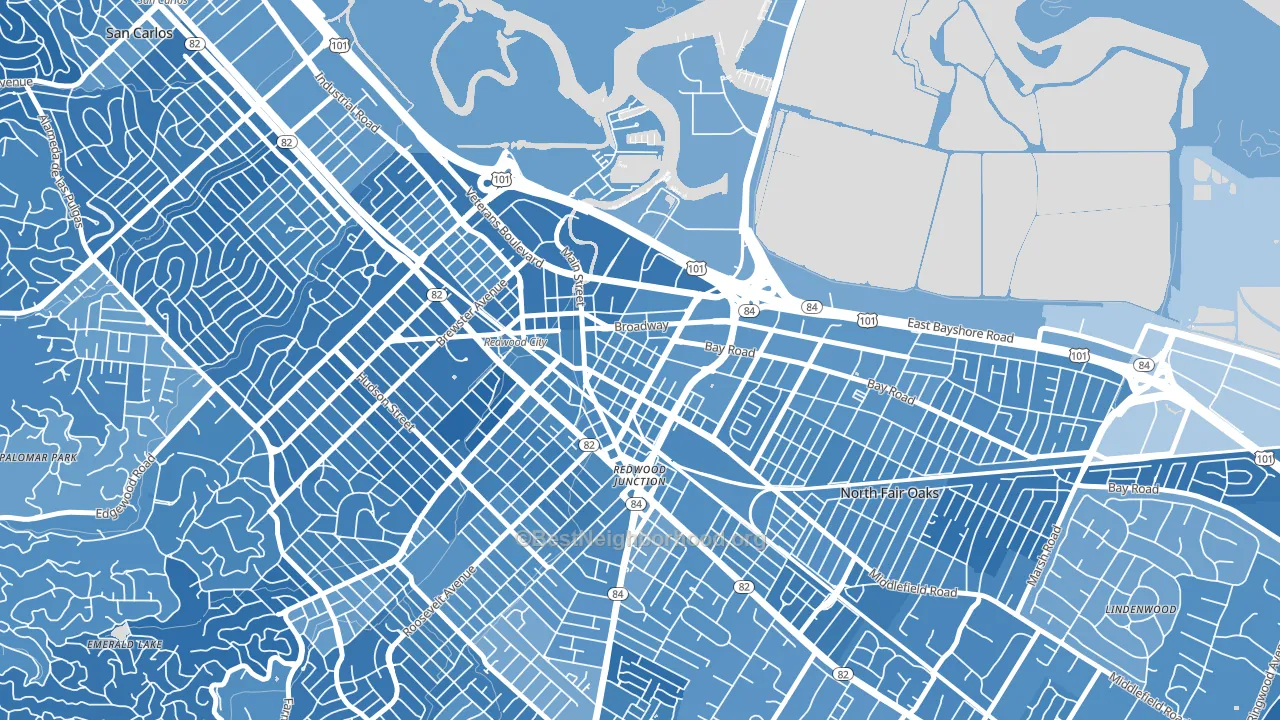
Politics vary noticeably by block within Staumbaugh Heller. The northwest side is the most Democratic-leaning (D+66) and the southwest side is the least Democratic-leaning (D+49), a spread of about 18 points.
Why Staumbaugh Heller leans the way it does
This analysis examined 14,881 data points per neighborhood to find what predicts political lean and turnout. The items below are a few correlations that stood out for Staumbaugh Heller, not a ranked or complete list of what matters most.
Dense areas vote Democratic. More than 99% of residents in Staumbaugh Heller live in densely developed areas, about 64 points above the U.S. average of 36%. A high never-married share predicts Democratic voting, and about 48% of adults in Staumbaugh Heller have never been married, above 79% of neighborhoods.
Population density and Democratic lean
Places with high population density tend to lean Democratic; Staumbaugh Heller, Redwood City, CA sits in the top tenth nationally on this measure.
Why turnout in Staumbaugh Heller looks the way it does
Areas with limited routine healthcare access turn out at lower rates. Staumbaugh Heller is in the bottom quarter nationally for routine-care measures such as insurance coverage, preventive screenings, and dental visits. Renters vote less often than owners, and about 84% of households in Staumbaugh Heller rent, compared to around 46% in nearby neighborhoods. Crowded housing lines up with lower turnout, and about 30% of homes in Staumbaugh Heller have more than one occupant per room, in the top fraction of neighborhoods. Learn more about the findings and methodology on the political spectrum map.
Nearby Neighborhoods
- Redwood Village, Redwood City, CA D+49
- Centennial, Redwood City, CA D+61
- Roosevelt-San Francisco, Redwood City, CA D+54
- Fair Oaks, North Fair Oaks, CA D+54
- Friendly Acres, Redwood City, CA D+47
- West Atherton, Atherton, CA D+43
- Farm Hills, Redwood City, CA D+59
- Emerald Lake Hills, Redwood City, CA D+54
- Downtown Menlo Park, Menlo Park, CA D+71
- Belle Haven, Menlo Park, CA D+50
Neighborhoods with Similar Populations
- Arlington South, Riverside, CA R+2
- Lansdowne, Charlotte, NC D+29
- The Islands, Gilbert, AZ R+5
- Martindale-Brightwood, Indianapolis, IN D+66
- Irvine Business Complex, Irvine, CA D+11
- Biltmore Shores, Massapequa, NY R+44
- University Park-San Antonio, San Antonio, TX D+30
- Downtown La Porte, La Porte, TX R+25
- Riverchase Country Club, Hoover, AL R+31
- Cotswold, Charlotte, NC D+25
Sources and methodology
Precinct-level voting records used to fit the model come from California Secretary of State, Elections, distributed by the Voting and Election Science Team. Demographic inputs come from the U.S. Census Bureau (ACS 5-year estimates and the 2020 Decennial Census). Health and environmental inputs come from the CDC (PLACES and the Environmental Justice Index). Land cover comes from the USGS and EPA. Election-day and lead-up weather come from PRISM 4km daily grids and the NOAA Global Historical Climatology Network. Mail-voting and election-administration patterns come from the MIT Election Lab's Survey of the Performance of American Elections. Block-group crime detail comes from CrimeGrade. Internet data and modeling support provided by ISPreports.org.
Modeling and analysis by the BestNeighborhood data science team. Full methodology and findings: political spectrum map.
Methodology reviewed by the BestNeighborhood data team. Last updated May 2026.