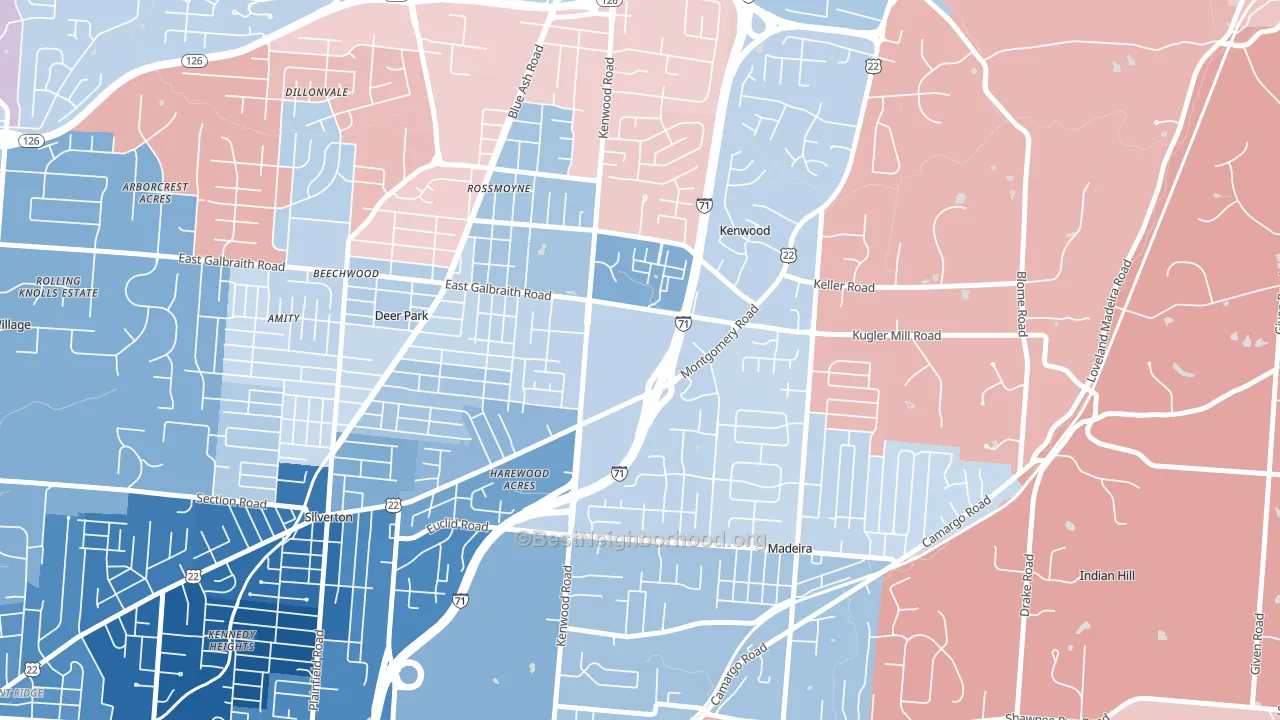
Kenwood leans slightly Democratic by roughly 12 points: about 56% of voters vote Democratic and 44% Republican.
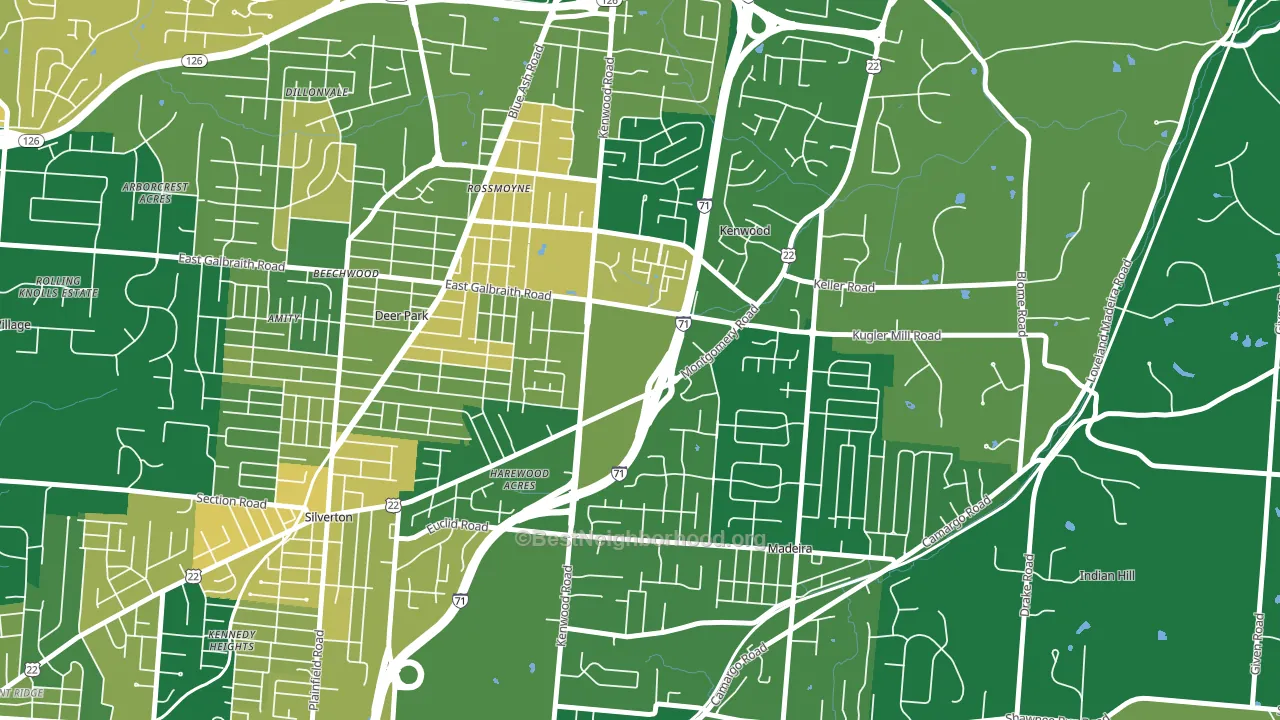
About 85% of adults in Kenwood typically vote, above the U.S. average of about 62%. Among adults in Kenwood, ~48% vote Democratic, ~37% Republican, and ~15% don't vote. The map below shows estimated turnout by block group.
How Kenwood compares
Among neighborhoods within 5 miles, Kenwood is the least Democratic-leaning.
Kenwood runs about 23 points more Democratic than Ohio as a whole. Ohio leans Republican overall, while Kenwood is one of the few Democratic-leaning pockets.
Politics vary noticeably by block within Kenwood. The north side is the most Democratic-leaning (D+20) and the northwest side is the least Democratic-leaning (D+2), a spread of about 18 points.
Why Kenwood leans the way it does
This analysis examined 14,881 data points per neighborhood to find what predicts political lean and turnout. The items below are a few correlations that stood out for Kenwood, not a ranked or complete list of what matters most.
Areas with high college attainment vote Democratic. About 72% of adults in Kenwood hold a bachelor's degree, about 43 points above the U.S. average of 28%. Kenwood runs against the grain of Ohio, a Democratic-leaning pocket in a Republican-leaning state.
Cancer-screening access and voter turnout
Places with high colon-cancer-screening access tend to turn out at a higher rate; Kenwood, Cincinnati, OH sits in the top quarter nationally on this measure. Cancer screening does not drive turnout; it reflects income, insurance, and healthcare access.
Why turnout in Kenwood looks the way it does
Areas with strong routine healthcare access turn out at higher rates. Kenwood is in the top quarter nationally for routine-care measures such as insurance coverage, preventive screenings, and dental visits. The dental-visit rate here is about 72%, about 12 points above the U.S. average of 60%. High high-school completion lines up with higher turnout, and about 98% of adults in Kenwood have completed high school, above 87% of neighborhoods. Learn more about the findings and methodology on the political spectrum map.
Nearby Neighborhoods
- Kennedy Heights, Cincinnati, OH D+70
- Madisonville, Cincinnati, OH D+46
- Pleasant Ridge, Cincinnati, OH D+55
- Oakley, Cincinnati, OH D+44
- Roselawn, Cincinnati, OH D+78
- Bond Hill, Cincinnati, OH D+72
- Hartwell, Cincinnati, OH D+40
- Hyde Park, Cincinnati, OH D+38
- Mount Lookout, Cincinnati, OH D+33
- Carthage, Cincinnati, OH D+34
Neighborhoods with Similar Populations
- Shirrells, San Bernardino, CA D+53
- Barnegat Pines, Forked River, NJ R+42
- Pill Hill, Oakland, CA D+79
- Columbine Knolls South, Columbine, CO D+3
- Summit Ridge at West Meadows, Dakota Ridge, CO D+15
- Colonial Avenue Area, Roanoke, VA D+20
- Long View, Milwaukee, WI D+69
- Oak Haven Heights, San Antonio, TX D+4
- Bravo Park Lane, Tucson, AZ D+36
- North Main Historic District, Mount Vernon, OH R+36
Sources and methodology
Precinct-level voting records used to fit the model come from Ohio Secretary of State, Elections, distributed by the Voting and Election Science Team. Demographic inputs come from the U.S. Census Bureau (ACS 5-year estimates and the 2020 Decennial Census). Health and environmental inputs come from the CDC (PLACES and the Environmental Justice Index). Land cover comes from the USGS and EPA. Election-day and lead-up weather come from PRISM 4km daily grids and the NOAA Global Historical Climatology Network. Mail-voting and election-administration patterns come from the MIT Election Lab's Survey of the Performance of American Elections. Block-group crime detail comes from CrimeGrade. Internet data and modeling support provided by ISPreports.org.
Modeling and analysis by the BestNeighborhood data science team. Full methodology and findings: political spectrum map.
Methodology reviewed by the BestNeighborhood data team. Last updated May 2026.