Pleasant Ridge is a Democratic stronghold. About 78% of voters here vote Democratic and 22% Republican.
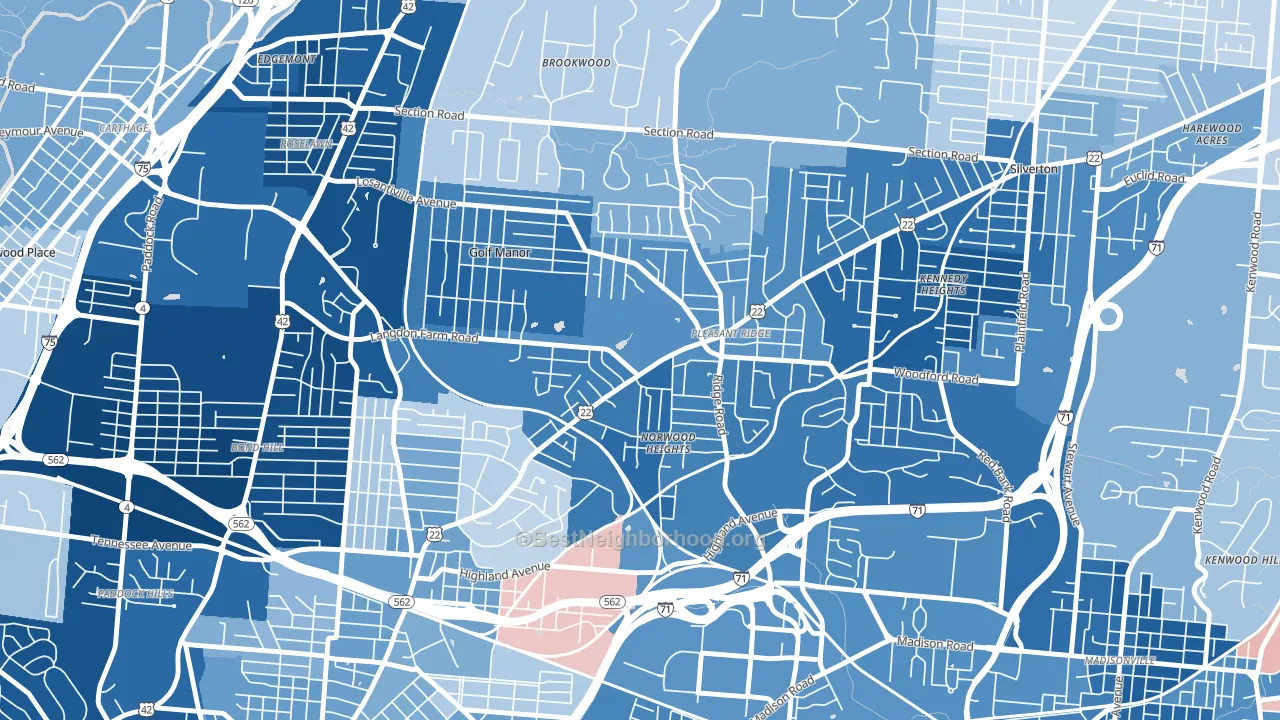
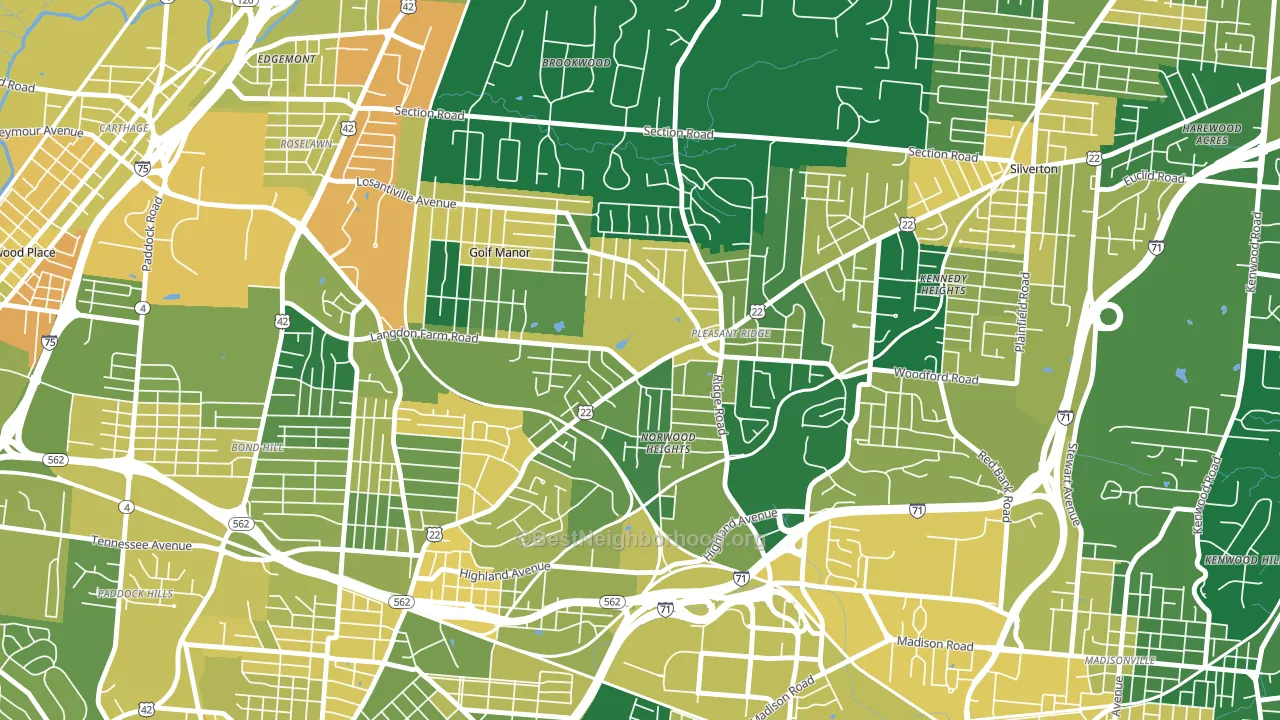
About 82% of adults in Pleasant Ridge typically vote, above the U.S. average of about 62%. Among adults in Pleasant Ridge, ~64% vote Democratic, ~18% Republican, and ~18% don't vote. The map below shows estimated turnout by block group.
How Pleasant Ridge compares
Among neighborhoods within 5 miles, Pleasant Ridge leans more Democratic than 7 of 15 neighbors.
Pleasant Ridge runs about 67 points more Democratic than Ohio as a whole. Ohio leans Republican overall, while Pleasant Ridge is one of the few Democratic-leaning pockets.
Politics vary noticeably by block within Pleasant Ridge. The northwest side is the most Democratic-leaning (D+70) and the southwest side is the least Democratic-leaning (D+32), a spread of about 39 points.
Why Pleasant Ridge leans the way it does
This analysis examined 14,881 data points per neighborhood to find what predicts political lean and turnout. The items below are a few correlations that stood out for Pleasant Ridge, not a ranked or complete list of what matters most.
Pleasant Ridge votes against the grain of Ohio. Ohio leans Republican overall, while Pleasant Ridge runs about 67 points more Democratic. High college attainment predicts Democratic voting, and Pleasant Ridge sits in the top quarter (about 55%, above 76% of neighborhoods).
Walkability and Democratic lean
Places with a highly walkable street grid tend to lean Democratic; Pleasant Ridge, Cincinnati, OH sits above the national average on this measure. A walkable street grid does not change how people vote; it mostly reflects how urban a place is.
Why turnout in Pleasant Ridge looks the way it does
Turnout in Pleasant Ridge sits close to the national pattern. Learn more about the findings and methodology on the political spectrum map.
Nearby Neighborhoods
- Kennedy Heights, Cincinnati, OH D+70
- Bond Hill, Cincinnati, OH D+72
- Roselawn, Cincinnati, OH D+78
- Oakley, Cincinnati, OH D+44
- Madisonville, Cincinnati, OH D+46
- Carthage, Cincinnati, OH D+34
- Hyde Park, Cincinnati, OH D+38
- Hartwell, Cincinnati, OH D+40
- Evanston, Cincinnati, OH D+63
- North Avondale, Cincinnati, OH D+81
Neighborhoods with Similar Populations
- South Side, Waltham, MA D+59
- Alamedan Valley, North Valley, NM D+17
- Aberdeen, Hampton, VA D+72
- Sterling Park, Sterling, VA D+23
- East Falls, Philadelphia, PA D+75
- West Ward, Easton, PA D+27
- Arlington, Riverside, CA D+11
- Waialae-Kahala, Honolulu, HI D+27
- Silver Lakes, Pembroke Pines, FL D+16
- Rancho West, San Bernardino, CA D+18
Sources and methodology
Precinct-level voting records used to fit the model come from Ohio Secretary of State, Elections, distributed by the Voting and Election Science Team. Demographic inputs come from the U.S. Census Bureau (ACS 5-year estimates and the 2020 Decennial Census). Health and environmental inputs come from the CDC (PLACES and the Environmental Justice Index). Land cover comes from the USGS and EPA. Election-day and lead-up weather come from PRISM 4km daily grids and the NOAA Global Historical Climatology Network. Mail-voting and election-administration patterns come from the MIT Election Lab's Survey of the Performance of American Elections. Block-group crime detail comes from CrimeGrade. Internet data and modeling support provided by ISPreports.org.
Modeling and analysis by the BestNeighborhood data science team. Full methodology and findings: political spectrum map.
Methodology reviewed by the BestNeighborhood data team. Last updated May 2026.