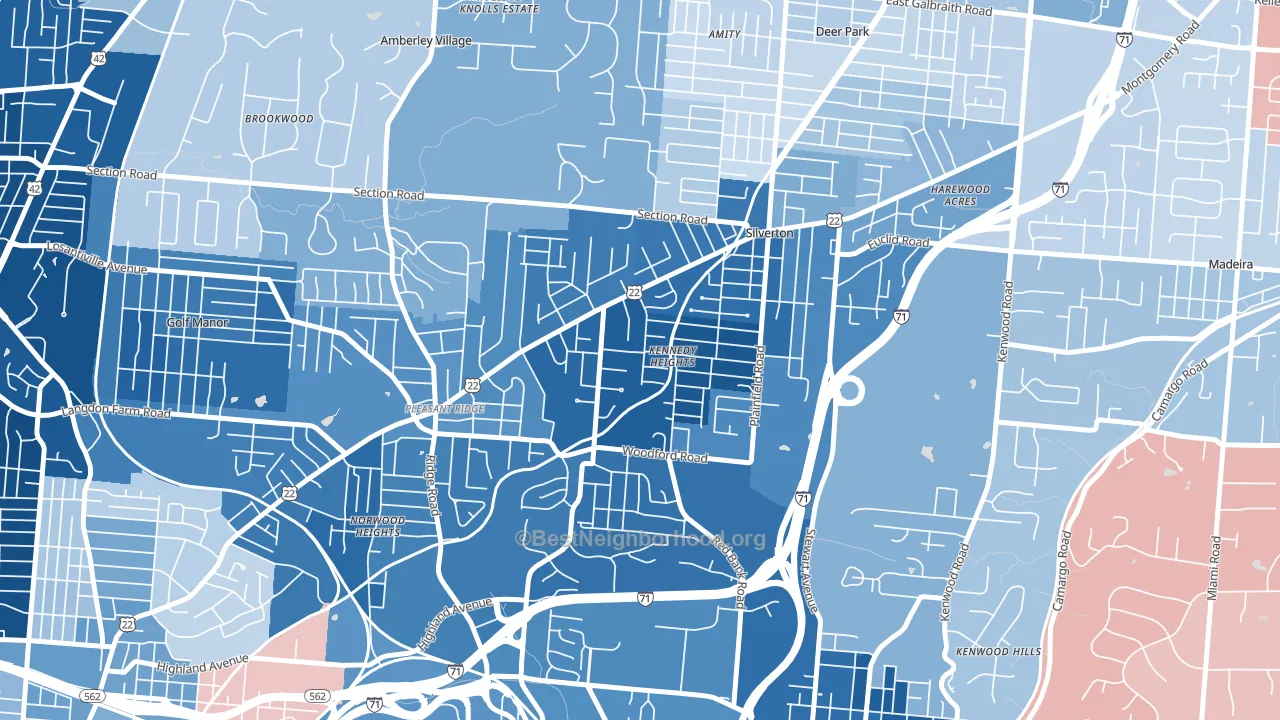
Kennedy Heights is a Democratic stronghold. About 85% of voters here vote Democratic and 15% Republican.
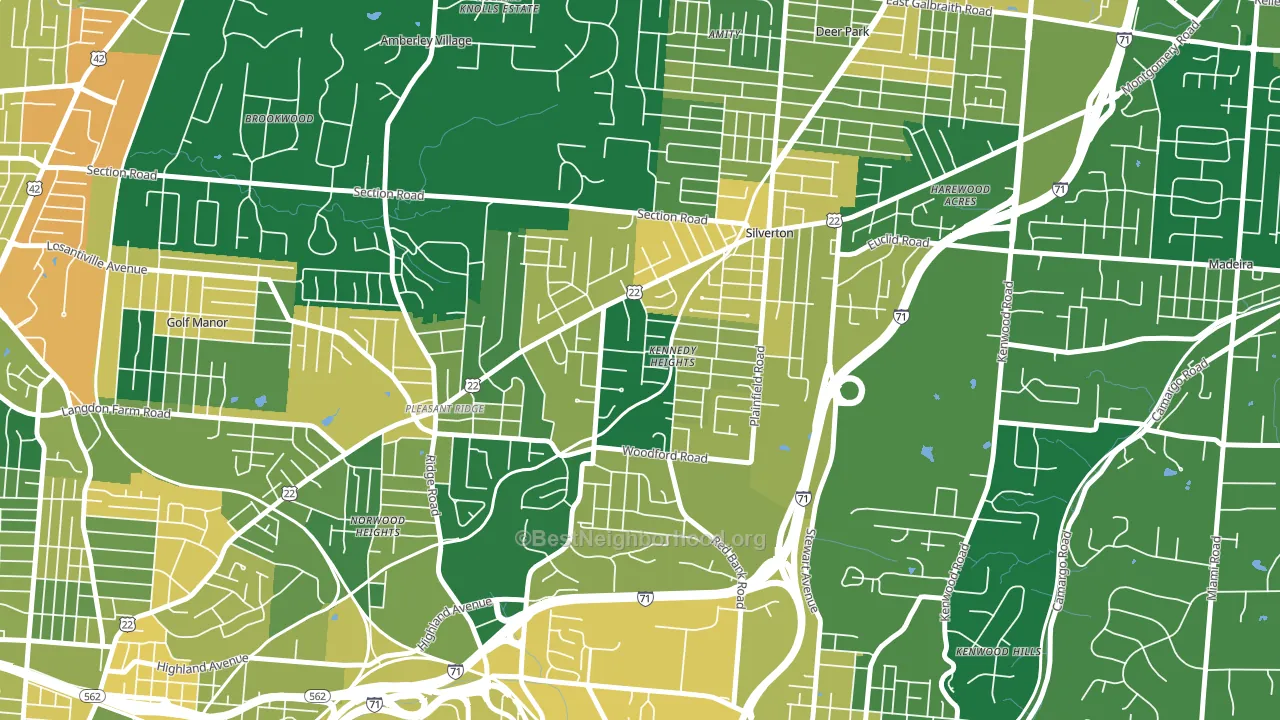
About 77% of adults in Kennedy Heights typically vote, above the U.S. average of about 62%. Among adults in Kennedy Heights, ~65% vote Democratic, ~12% Republican, and ~23% don't vote. The map below shows estimated turnout by block group.
How Kennedy Heights compares
Among neighborhoods within 5 miles, Kennedy Heights leans more Democratic than 9 of 12 neighbors.
Kennedy Heights runs about 81 points more Democratic than Ohio as a whole. Ohio leans Republican overall, while Kennedy Heights is one of the few Democratic-leaning pockets.
Politics vary noticeably by block within Kennedy Heights. The east side is the most Democratic-leaning (D+78) and the southwest side is the least Democratic-leaning (D+64), a spread of about 14 points.
Why Kennedy Heights leans the way it does
This analysis examined 14,881 data points per neighborhood to find what predicts political lean and turnout. The items below are a few correlations that stood out for Kennedy Heights, not a ranked or complete list of what matters most.
Kennedy Heights votes against the grain of Ohio. Ohio leans Republican overall, while Kennedy Heights runs about 81 points more Democratic.
Population density and Democratic lean
Places with high population density tend to lean Democratic; Kennedy Heights, Cincinnati, OH sits above the national average on this measure.
Why turnout in Kennedy Heights looks the way it does
Turnout in Kennedy Heights sits close to the national pattern. Routine healthcare access, homeownership, education, and food security all land near their national averages here. Learn more about the findings and methodology on the political spectrum map.
Nearby Neighborhoods
- Pleasant Ridge, Cincinnati, OH D+55
- Madisonville, Cincinnati, OH D+46
- Kenwood, Cincinnati, OH D+12
- Oakley, Cincinnati, OH D+44
- Roselawn, Cincinnati, OH D+78
- Bond Hill, Cincinnati, OH D+72
- Hyde Park, Cincinnati, OH D+38
- Carthage, Cincinnati, OH D+34
- Mount Lookout, Cincinnati, OH D+33
- Hartwell, Cincinnati, OH D+40
Neighborhoods with Similar Populations
- Taylor Run, Alexandria, VA D+50
- Northwest Village, West Sacramento, CA D+21
- Shadow Hills, Sunland, CA R+6
- Village Centre, Menomonee Falls, WI R+4
- North Country Meadows, Oildale, CA R+42
- West Gate, Toledo, OH D+34
- Monte Vista, San Antonio, TX D+51
- Larkfield-Wikiup, Santa Rosa, CA D+31
- Junior College Neighborhood Assc., Santa Rosa, CA D+62
- Wakefield, Tucson, AZ D+43
Sources and methodology
Precinct-level voting records used to fit the model come from Ohio Secretary of State, Elections, distributed by the Voting and Election Science Team. Demographic inputs come from the U.S. Census Bureau (ACS 5-year estimates and the 2020 Decennial Census). Health and environmental inputs come from the CDC (PLACES and the Environmental Justice Index). Land cover comes from the USGS and EPA. Election-day and lead-up weather come from PRISM 4km daily grids and the NOAA Global Historical Climatology Network. Mail-voting and election-administration patterns come from the MIT Election Lab's Survey of the Performance of American Elections. Block-group crime detail comes from CrimeGrade. Internet data and modeling support provided by ISPreports.org.
Modeling and analysis by the BestNeighborhood data science team. Full methodology and findings: political spectrum map.
Methodology reviewed by the BestNeighborhood data team. Last updated May 2026.