Kirtland Community leans heavily Democratic by roughly 36 points: about 68% of voters vote Democratic and 32% Republican.
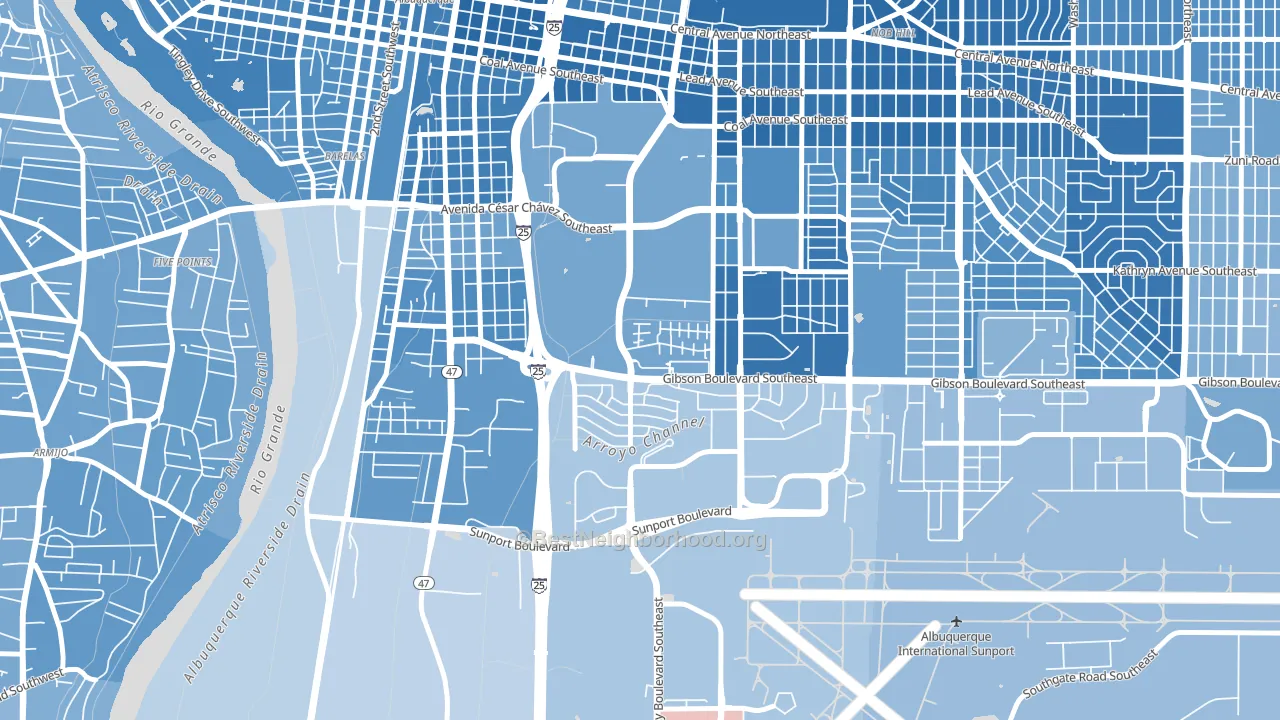
About 40% of adults in Kirtland Community typically vote, below the U.S. average of about 62%. Among adults in Kirtland Community, ~27% vote Democratic, ~13% Republican, and ~60% don't vote. The map below shows estimated turnout by block group.
How Kirtland Community compares
Among neighborhoods within 5 miles, Kirtland Community leans more Democratic than 9 of 16 neighbors.
Kirtland Community runs about 29 points more Democratic than New Mexico as a whole.
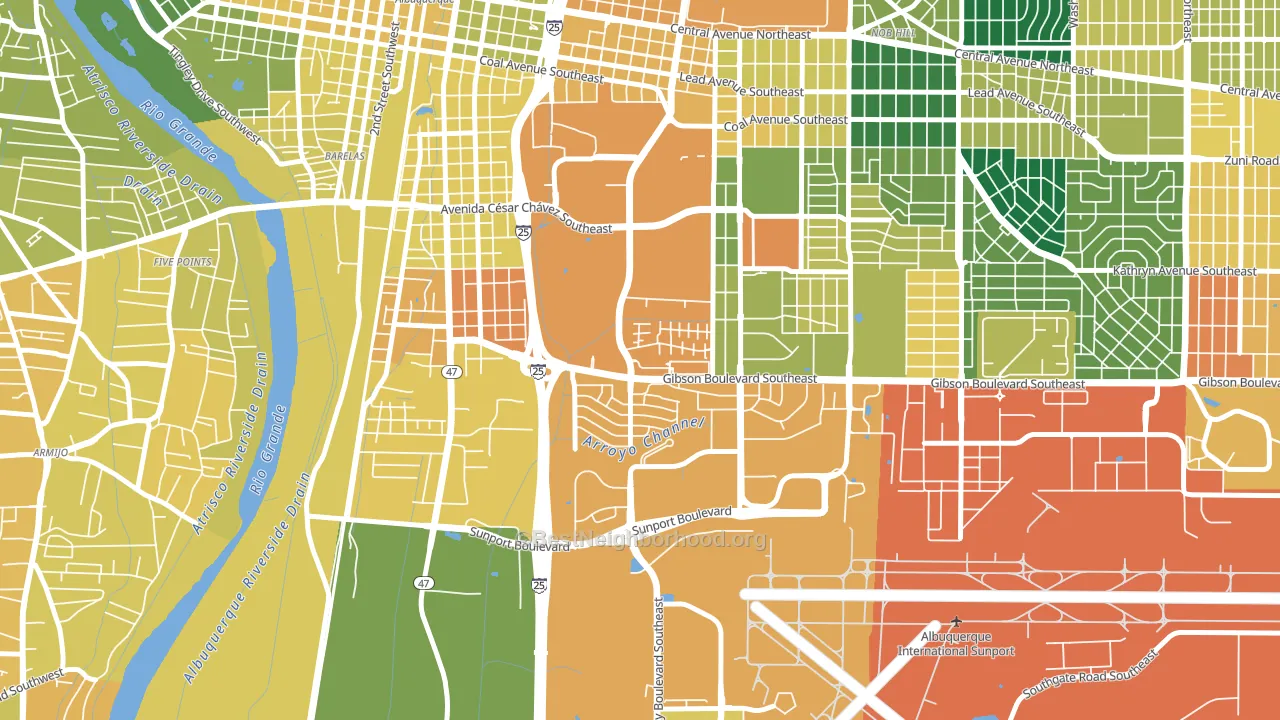
Politics vary noticeably by block within Kirtland Community. The northeast side is the most Democratic-leaning (D+53) and the west side is the least Democratic-leaning (D+29), a spread of about 24 points.
Why Kirtland Community leans the way it does
This analysis examined 14,881 data points per neighborhood to find what predicts political lean and turnout. The items below are a few correlations that stood out for Kirtland Community, not a ranked or complete list of what matters most.
Areas with many never-married adults vote Democratic. About 54% of adults in Kirtland Community have never been married, modestly above similar-sized neighborhoods (around 45%).
Cancer-screening access and voter turnout
Places with low colon-cancer-screening access tend to turn out at a lower rate; Kirtland Community, Albuquerque, NM sits in the bottom tenth nationally on this measure. Cancer screening does not drive turnout; it reflects income, insurance, and healthcare access.
Why turnout in Kirtland Community looks the way it does
Areas with limited routine healthcare access turn out at lower rates. Kirtland Community is in the bottom quarter nationally for routine-care measures such as insurance coverage, preventive screenings, and dental visits. The uninsured rate here is about 20%, about 10 points above the U.S. average of 10%. High food insecurity lines up with lower turnout, and about 36% of adults in Kirtland Community report food insecurity, above 90% of neighborhoods. High-crime urban areas turn out at lower rates, and Kirtland Community sits in the top 15% on a violent-crime measure. Learn more about the findings and methodology on the political spectrum map.
Nearby Neighborhoods
- Victory Hills, Albuquerque, NM D+51
- South Broadway, Albuquerque, NM D+48
- Se Heights, Albuquerque, NM D+55
- Nob Hill, Albuquerque, NM D+72
- Downtown, Albuquerque, NM D+57
- South San Pedro, Albuquerque, NM D+30
- South Atrisco, South Valley, NM D+20
- Near N Valley, Albuquerque, NM D+42
- Mountain View, South Valley, NM D+12
- Trumbull Village, Albuquerque, NM D+23
Neighborhoods with Similar Populations
- Castle Ranch, Bakersfield, CA R+7
- Lincoln Place, Pittsburgh, PA R+5
- Imperial Lakes, Fuller Heights, FL R+37
- Tempe Royal Estates, Tempe, AZ D+22
- Bernice, Lansing, IL D+52
- Golden Triangle, Denver, CO D+60
- Cramer Hill, Camden, NJ D+51
- Castle Rouge, Detroit, MI D+82
- Volker, Kansas City, MO D+66
- Eagle Bay, Kissimmee, FL D+11
Sources and methodology
Precinct-level voting records used to fit the model come from New Mexico Secretary of State, Bureau of Elections, distributed by the Voting and Election Science Team. Demographic inputs come from the U.S. Census Bureau (ACS 5-year estimates and the 2020 Decennial Census). Health and environmental inputs come from the CDC (PLACES and the Environmental Justice Index). Land cover comes from the USGS and EPA. Election-day and lead-up weather come from PRISM 4km daily grids and the NOAA Global Historical Climatology Network. Mail-voting and election-administration patterns come from the MIT Election Lab's Survey of the Performance of American Elections. Block-group crime detail comes from CrimeGrade. Internet data and modeling support provided by ISPreports.org.
Modeling and analysis by the BestNeighborhood data science team. Full methodology and findings: political spectrum map.
Methodology reviewed by the BestNeighborhood data team. Last updated May 2026.