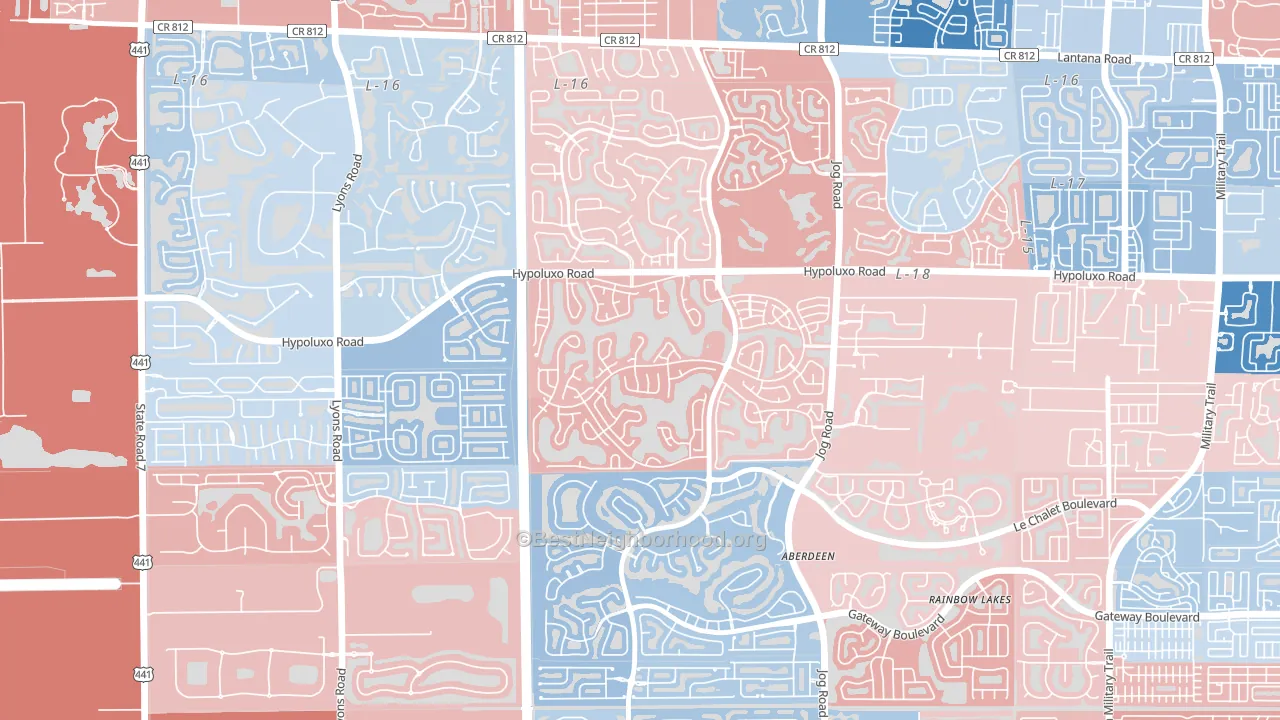
Lake Charleston is a true toss-up. About 48% of voters here vote Democratic and 52% Republican.
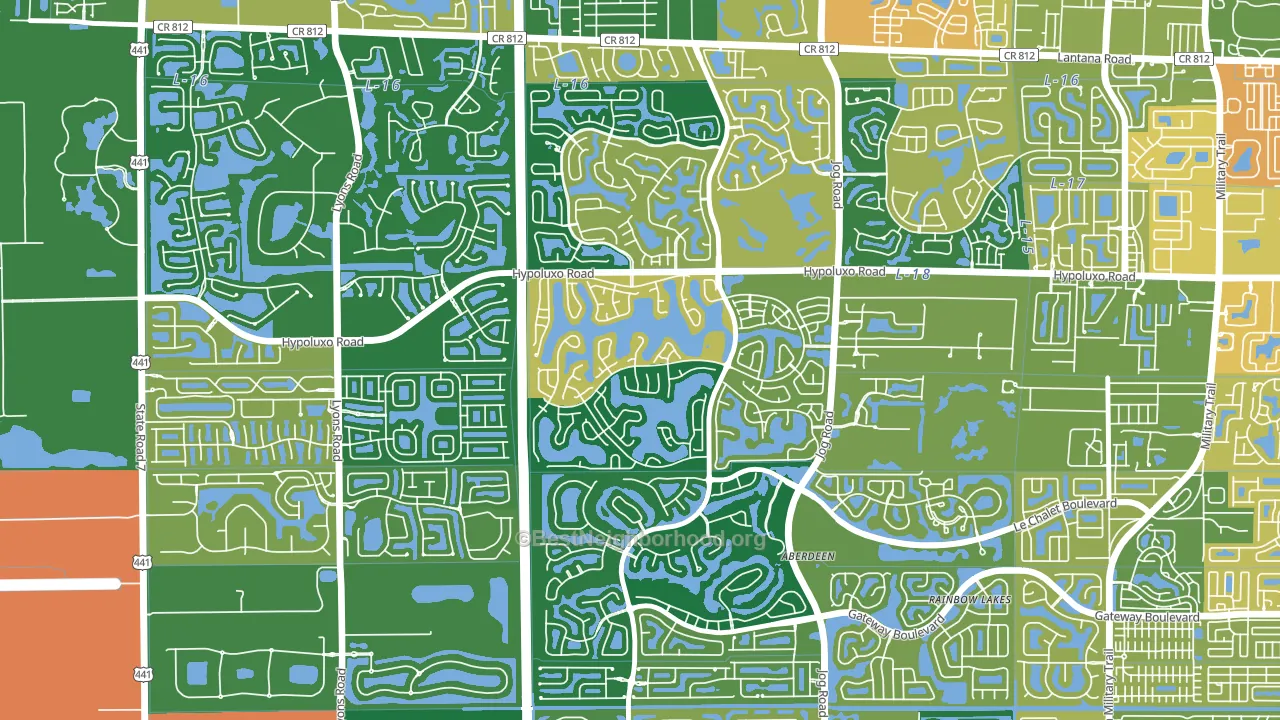
About 78% of adults in Lake Charleston typically vote, above the U.S. average of about 62%. Among adults in Lake Charleston, ~37% vote Democratic, ~41% Republican, and ~22% don't vote. The map below shows estimated turnout by block group.
How Lake Charleston compares
Among neighborhoods within 5 miles, Lake Charleston is the most Republican-leaning.
Lake Charleston runs about 9 points more Democratic than Florida as a whole.
Why Lake Charleston leans the way it does
Density, race composition, education, and family structure all sit close to their national averages in Lake Charleston. The lean here lands roughly where demographic data alone would predict.
Park access and Republican lean
Places with low park coverage tend to lean Republican; Lake Charleston, Lake Worth, FL sits in the bottom tenth nationally on this measure. Park access does not change how people vote; it tends to track denser, higher-income areas.
Why turnout in Lake Charleston looks the way it does
Homeowners vote more often than renters. About 90% of households in Lake Charleston own their home, about 19 points above the Florida average of 71%. Learn more about the findings and methodology on the political spectrum map.
Nearby Neighborhoods
- Smith Dairy West, Lake Worth, FL D+3
- Indian Spring, Boynton Beach, FL D+18
- Meadows, Boynton Beach, FL D+16
- Boynton Lakes Plaza, Boynton Beach, FL D+6
- Emerald Lake-Miami, Lake Worth, FL D+30
- Olympia, Wellington, FL Even
- Leisureville, Boynton Beach, FL Even
- South Shore of Wellington, Wellington, FL R+3
- Sugar Pond Manor of Wellington, Wellington, FL R+6
- South Side, West Palm Beach, FL Even
Neighborhoods with Similar Populations
- City Center, Aurora, CO D+45
- La Avenida, Rochester, NY D+62
- Lower Chelsea, Atlantic City, NJ D+15
- Bayside, Everett, WA D+36
- Woodbine, Nashville, TN D+26
- Terra del Sol, Houston, TX D+40
- South Westside, Olympia, WA D+54
- Jacksonville Heights South, Jacksonville, FL D+10
- Montclair, Oakland, CA D+71
- Hampden South, Denver, CO D+37
Sources and methodology
Precinct-level voting records used to fit the model come from Florida Division of Elections, distributed by the Voting and Election Science Team. Demographic inputs come from the U.S. Census Bureau (ACS 5-year estimates and the 2020 Decennial Census). Health and environmental inputs come from the CDC (PLACES and the Environmental Justice Index). Land cover comes from the USGS and EPA. Election-day and lead-up weather come from PRISM 4km daily grids and the NOAA Global Historical Climatology Network. Mail-voting and election-administration patterns come from the MIT Election Lab's Survey of the Performance of American Elections. Block-group crime detail comes from CrimeGrade. Internet data and modeling support provided by ISPreports.org.
Modeling and analysis by the BestNeighborhood data science team. Full methodology and findings: political spectrum map.
Methodology reviewed by the BestNeighborhood data team. Last updated May 2026.