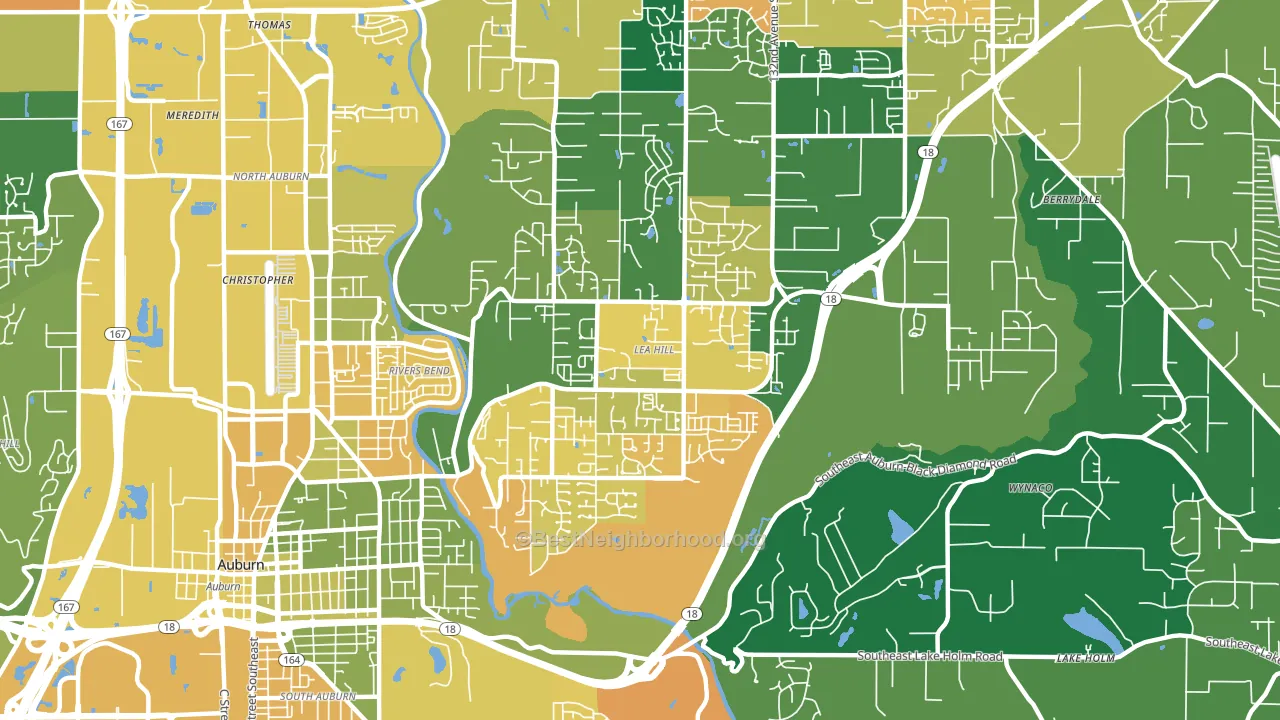
Lea Hill leans Democratic by roughly 18 points: about 59% of voters vote Democratic and 41% Republican.
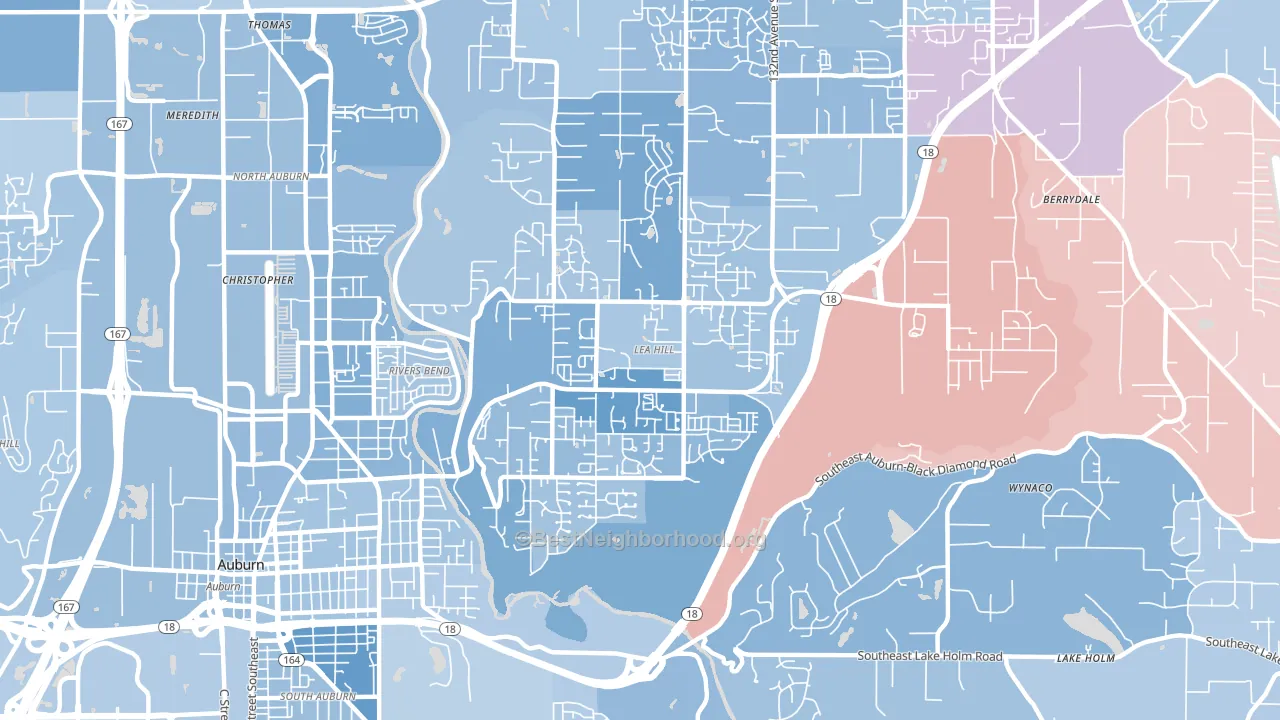
About 60% of adults in Lea Hill typically vote, near the U.S. average of about 62%. Among adults in Lea Hill, ~36% vote Democratic, ~25% Republican, and ~39% don't vote. The map below shows estimated turnout by block group.
How Lea Hill compares
Politically, Lea Hill sits close to the rest of Washington.
Why Lea Hill leans the way it does
Density, race composition, education, and family structure all sit close to their national averages in Lea Hill. The lean here lands roughly where demographic data alone would predict.
Housing overcrowding and voter turnout
Places with heavy housing overcrowding tend to turn out at a lower rate; Lea Hill, Auburn, WA sits in the top quarter nationally on this measure.
Why turnout in Lea Hill looks the way it does
Turnout in Lea Hill sits close to the national pattern. Routine healthcare access, homeownership, education, and food security all land near their national averages here. Learn more about the findings and methodology on the political spectrum map.
Nearby Neighborhoods
- Downtown, Kent, WA D+36
- Zenith, Des Moines, WA D+29
- Fairwood Greens, Fairwood, WA D+31
- Maple Heights-Lake Desire, Renton, WA D+17
- Twin Lakes, Federal Way, WA D+28
- North Hill, Des Moines, WA D+23
- Northeast Tacoma, Tacoma, WA D+23
- Highlands Park, Renton, WA D+37
- Waller, Tacoma, WA R+4
- Kennydale, Renton, WA D+30
Neighborhoods with Similar Populations
- Girard Estates, Philadelphia, PA D+17
- Citrus Grove, Glendale, CA D+5
- Playa del Ray, Playa Del Rey, CA D+43
- North Westminster, Westminster, CO D+13
- Manayunk, Philadelphia, PA D+56
- Getty Square, Yonkers, NY D+51
- Bay Park, San Diego, CA D+30
- Great Kills, Staten Island, NY R+51
- Ottawa, Toledo, OH D+55
- Gandy-Sun Bay South, Tampa, FL D+3
Sources and methodology
Precinct-level voting records used to fit the model come from Washington Secretary of State, Elections, distributed by the Voting and Election Science Team. Demographic inputs come from the U.S. Census Bureau (ACS 5-year estimates and the 2020 Decennial Census). Health and environmental inputs come from the CDC (PLACES and the Environmental Justice Index). Land cover comes from the USGS and EPA. Election-day and lead-up weather come from PRISM 4km daily grids and the NOAA Global Historical Climatology Network. Mail-voting and election-administration patterns come from the MIT Election Lab's Survey of the Performance of American Elections. Block-group crime detail comes from CrimeGrade. Internet data and modeling support provided by ISPreports.org.
Modeling and analysis by the BestNeighborhood data science team. Full methodology and findings: political spectrum map.
Methodology reviewed by the BestNeighborhood data team. Last updated May 2026.