Little Woods is a Democratic stronghold. About 91% of voters here vote Democratic and 9% Republican.
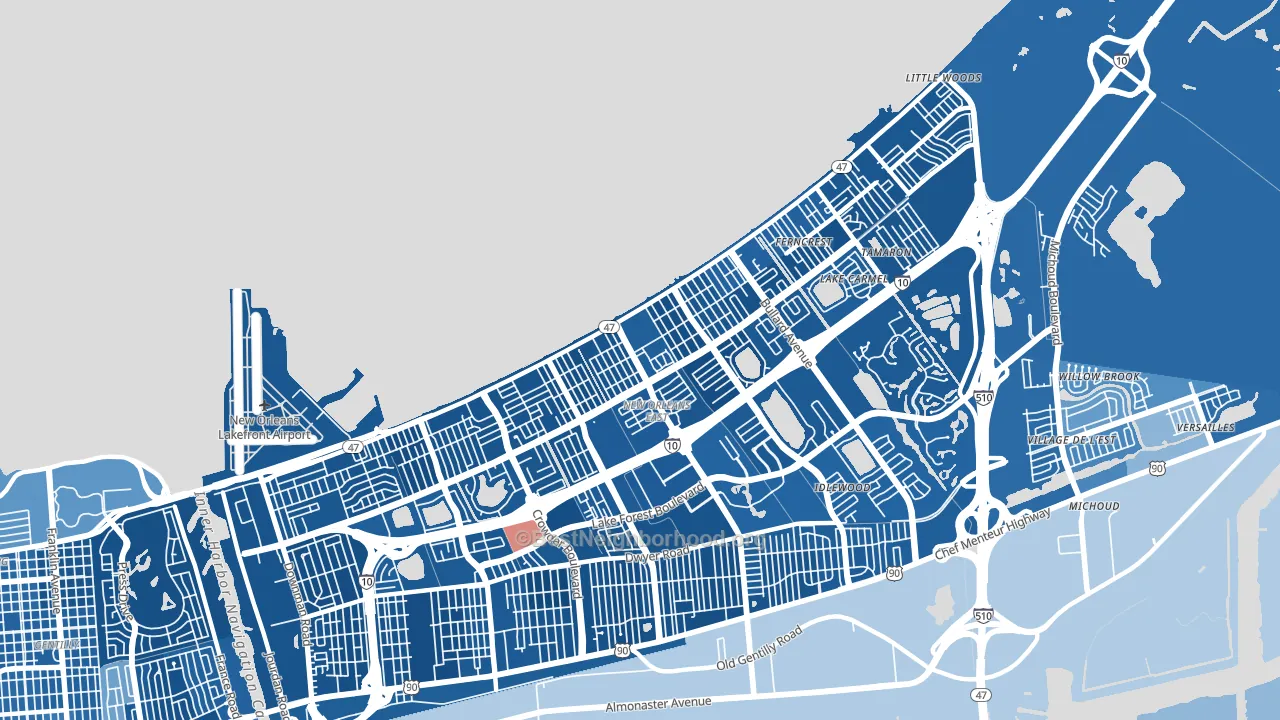
About 55% of adults in Little Woods typically vote, below the U.S. average of about 62%. Among adults in Little Woods, ~50% vote Democratic, ~5% Republican, and ~45% don't vote. The map below shows estimated turnout by block group.
How Little Woods compares
Among neighborhoods within 5 miles, Little Woods leans more Democratic than 4 of 8 neighbors.
Little Woods runs about 105 points more Democratic than Louisiana as a whole. Louisiana leans Republican overall, while Little Woods is one of the few Democratic-leaning pockets.
Why Little Woods leans the way it does
This analysis examined 14,881 data points per neighborhood to find what predicts political lean and turnout. The items below are a few correlations that stood out for Little Woods, not a ranked or complete list of what matters most.
Little Woods votes against the grain of Louisiana. Louisiana leans Republican overall, while Little Woods runs about 105 points more Democratic. A high never-married share predicts Democratic voting, and about 51% of adults in Little Woods have never been married, above 84% of neighborhoods.
Preventive-care access and voter turnout
Places with limited routine preventive-care access tend to turn out at a lower rate; Little Woods, New Orleans, LA sits in the bottom quarter nationally on this measure. Dental visits do not drive turnout; the rate reflects income, insurance, and healthcare access, which line up with who votes.
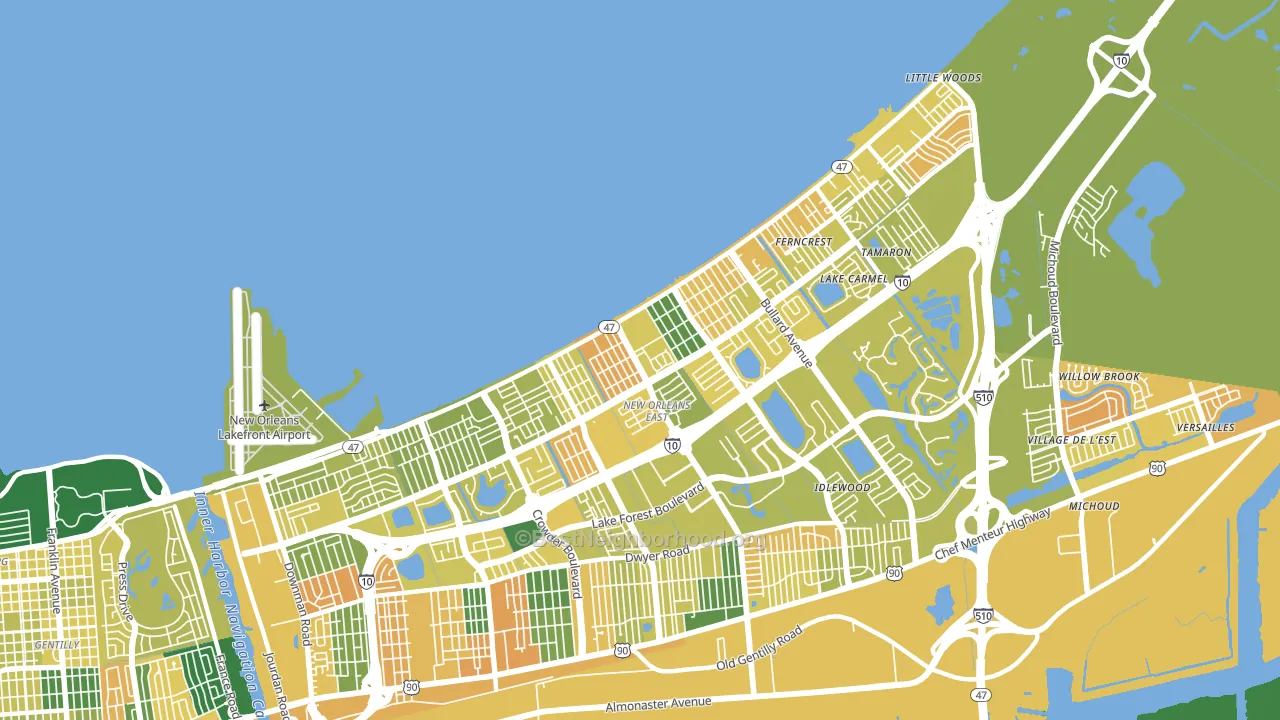
Why turnout in Little Woods looks the way it does
Areas with high food insecurity turn out at lower rates. About 38% of adults in Little Woods report food insecurity, about 22 points above the U.S. average of 16%. Limited routine healthcare access lines up with lower turnout, and Little Woods sits in the bottom quarter on routine-care measures. Learn more about the findings and methodology on the political spectrum map.
Nearby Neighborhoods
- West Lake Forest, New Orleans, LA D+85
- Read Blvd West, New Orleans, LA D+87
- Read Blvd East, New Orleans, LA D+80
- Plum Orchard, New Orleans, LA D+84
- Pines Village, New Orleans, LA D+87
- Village de L'Est, New Orleans, LA D+50
- Gentilly Woods, New Orleans, LA D+73
- Milneburg, New Orleans, LA D+77
- Gentilly Terrace, New Orleans, LA D+75
- Lake Terrace and Oaks, New Orleans, LA D+41
Neighborhoods with Similar Populations
- Roseland, Chicago, IL D+84
- North Valleys, Reno, NV R+3
- La Sierra, Riverside, CA D+9
- Berclair-Highland Heights, Memphis, TN D+23
- Avondale, Chicago, IL D+61
- South Lawndale, Chicago, IL D+41
- Charlotte Gardens, Bronx, NY D+50
- West University, Houston, TX D+14
- Throgs Neck-Edgewater Park, Bronx, NY D+4
- Clairemont Mesa, San Diego, CA D+24
Sources and methodology
Precinct-level voting records used to fit the model come from Louisiana Secretary of State, Elections, distributed by the Voting and Election Science Team. Demographic inputs come from the U.S. Census Bureau (ACS 5-year estimates and the 2020 Decennial Census). Health and environmental inputs come from the CDC (PLACES and the Environmental Justice Index). Land cover comes from the USGS and EPA. Election-day and lead-up weather come from PRISM 4km daily grids and the NOAA Global Historical Climatology Network. Mail-voting and election-administration patterns come from the MIT Election Lab's Survey of the Performance of American Elections. Block-group crime detail comes from CrimeGrade. Internet data and modeling support provided by ISPreports.org.
Modeling and analysis by the BestNeighborhood data science team. Full methodology and findings: political spectrum map.
Methodology reviewed by the BestNeighborhood data team. Last updated May 2026.