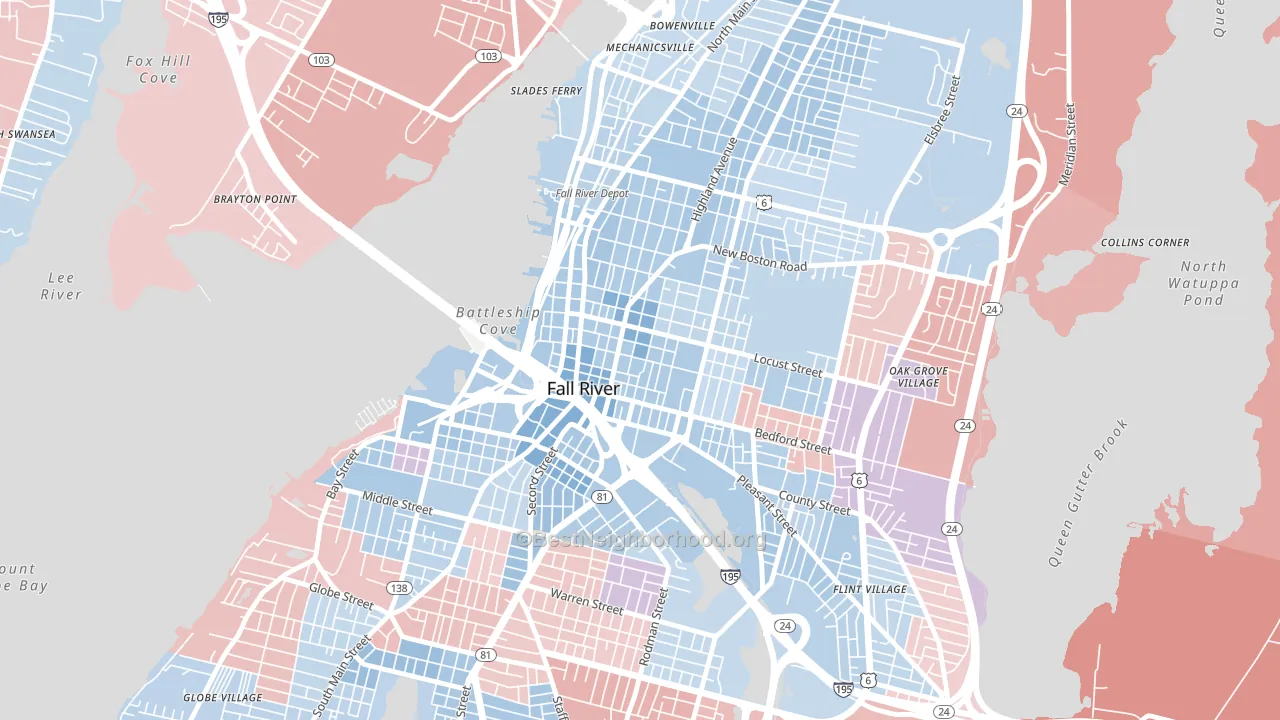
Lower Highlands leans slightly Democratic by roughly 10 points: about 55% of voters vote Democratic and 45% Republican.
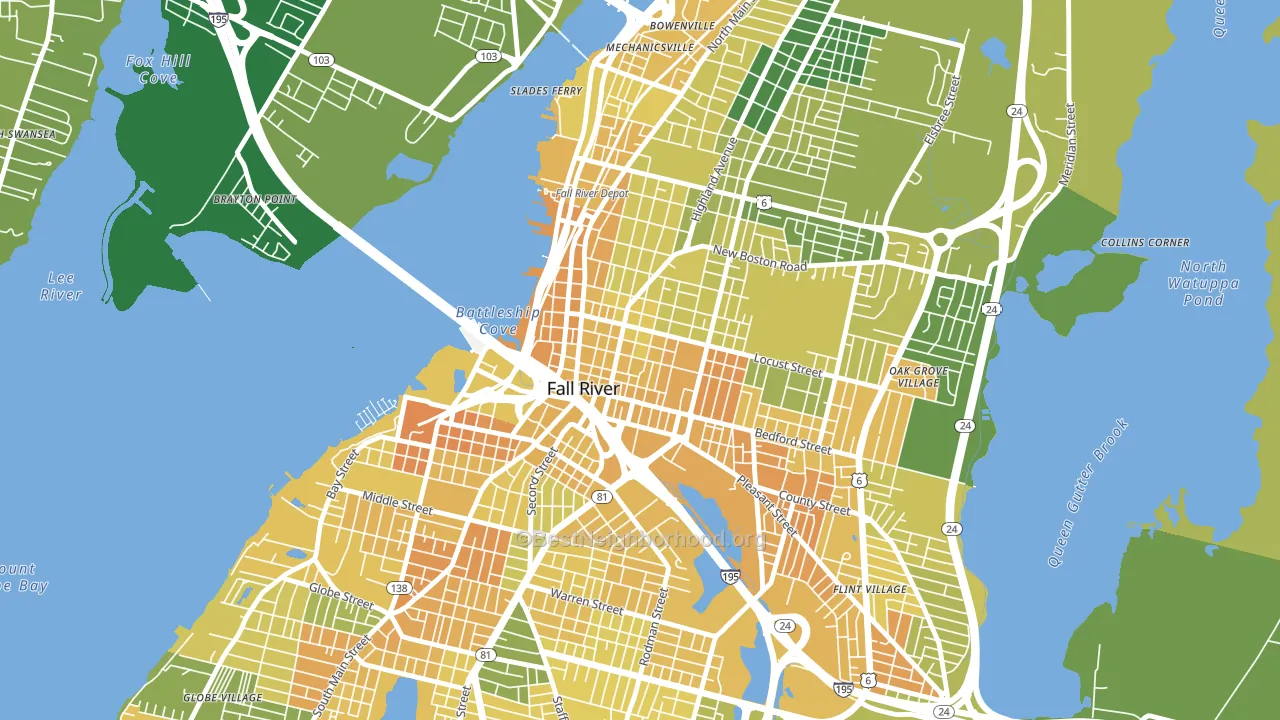
About 39% of adults in Lower Highlands typically vote, below the U.S. average of about 62%. Among adults in Lower Highlands, ~21% vote Democratic, ~18% Republican, and ~61% don't vote. The map below shows estimated turnout by block group.
How Lower Highlands compares
Among neighborhoods within 5 miles, Lower Highlands is the most Democratic-leaning.
Lower Highlands runs about 15 points more Republican than Massachusetts as a whole.
Politics vary noticeably by block within Lower Highlands. The west side is the most Democratic-leaning (D+18) and the southeast side is the least Democratic-leaning (D+2), a spread of about 16 points.
Why Lower Highlands leans the way it does
This analysis examined 14,881 data points per neighborhood to find what predicts political lean and turnout. The items below are a few correlations that stood out for Lower Highlands, not a ranked or complete list of what matters most.
Areas with many never-married adults vote Democratic. About 49% of adults in Lower Highlands have never been married, modestly above similar-sized neighborhoods (around 41%).
Population density and Democratic lean
Places with high population density tend to lean Democratic; Lower Highlands, Fall River, MA sits in the top tenth nationally on this measure.
Why turnout in Lower Highlands looks the way it does
Renters vote less often than owners. About 79% of households in Lower Highlands rent, about 54 points above the U.S. average of 25%. High food insecurity lines up with lower turnout, and about 29% of adults in Lower Highlands report food insecurity, above 81% of neighborhoods. Low high-school completion lines up with lower turnout, and about 75% of adults in Lower Highlands have completed high school, below 91% of neighborhoods. Learn more about the findings and methodology on the political spectrum map.
Nearby Neighborhoods
- Corky Row, Fall River, MA D+3
- Flint Village, Fall River, MA Even
- North End, Fall River, MA D+4
- Highlands-Providence, Fall River, MA R+4
- Sandy Beach, Fall River, MA Even
- Maplewood, Fall River, MA R+6
- Steep Brook, Fall River, MA Even
- Kent Corner, Riverside, RI D+5
- Oakland Beach, Warwick, RI D+5
- Kent Heights, East Providence, RI D+7
Neighborhoods with Similar Populations
- Mill Park, Portland, OR D+31
- Kamuela, Waimea, HI D+24
- Mount Airy, Cincinnati, OH D+58
- Ivey Ranch-Rancho del Oro, Oceanside, CA D+13
- Belmont, Dayton, OH Even
- Berkeley, Martinsburg, WV R+23
- Martin Luther King, Shreveport, LA D+78
- Lyell-Otis, Rochester, NY D+49
- Northwest, Manchester, NH D+25
- Issaquah Highlands, Issaquah, WA D+45
Sources and methodology
Precinct-level voting records used to fit the model come from Massachusetts Secretary of the Commonwealth, Elections, distributed by the Voting and Election Science Team. Demographic inputs come from the U.S. Census Bureau (ACS 5-year estimates and the 2020 Decennial Census). Health and environmental inputs come from the CDC (PLACES and the Environmental Justice Index). Land cover comes from the USGS and EPA. Election-day and lead-up weather come from PRISM 4km daily grids and the NOAA Global Historical Climatology Network. Mail-voting and election-administration patterns come from the MIT Election Lab's Survey of the Performance of American Elections. Block-group crime detail comes from CrimeGrade. Internet data and modeling support provided by ISPreports.org.
Modeling and analysis by the BestNeighborhood data science team. Full methodology and findings: political spectrum map.
Methodology reviewed by the BestNeighborhood data team. Last updated May 2026.