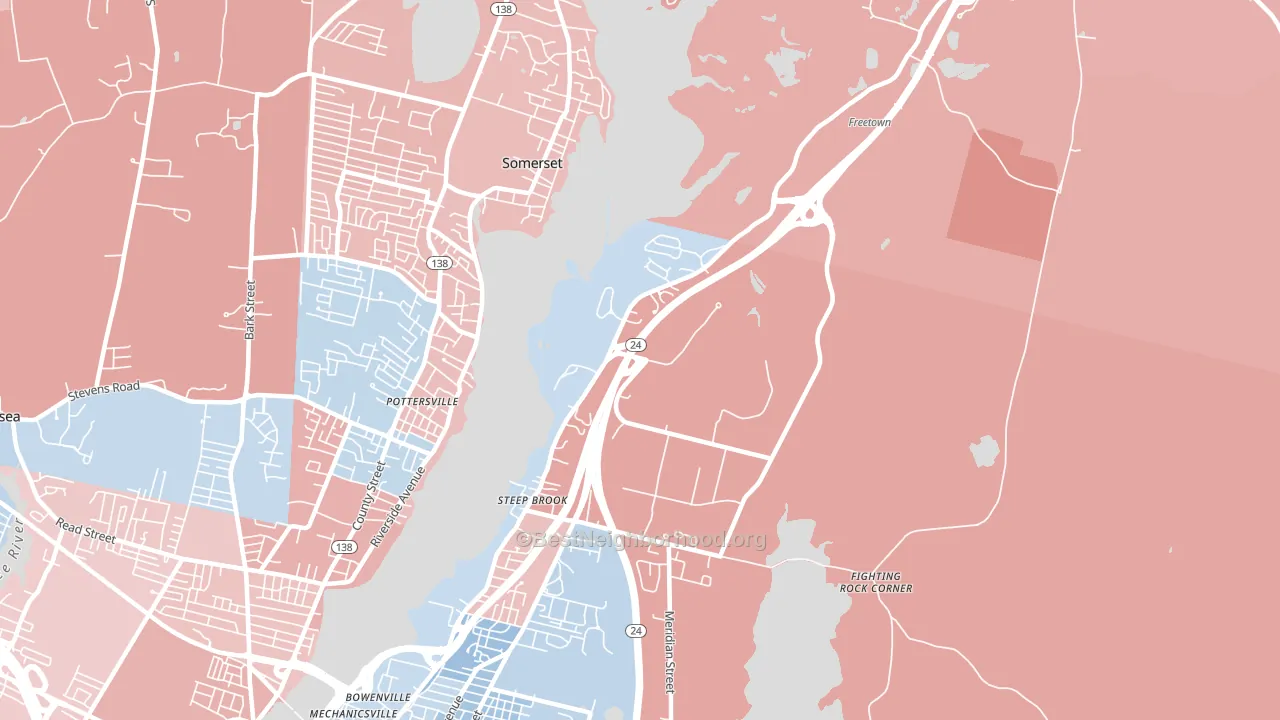
Steep Brook is a true toss-up. About 50% of voters here vote Democratic and 50% Republican.
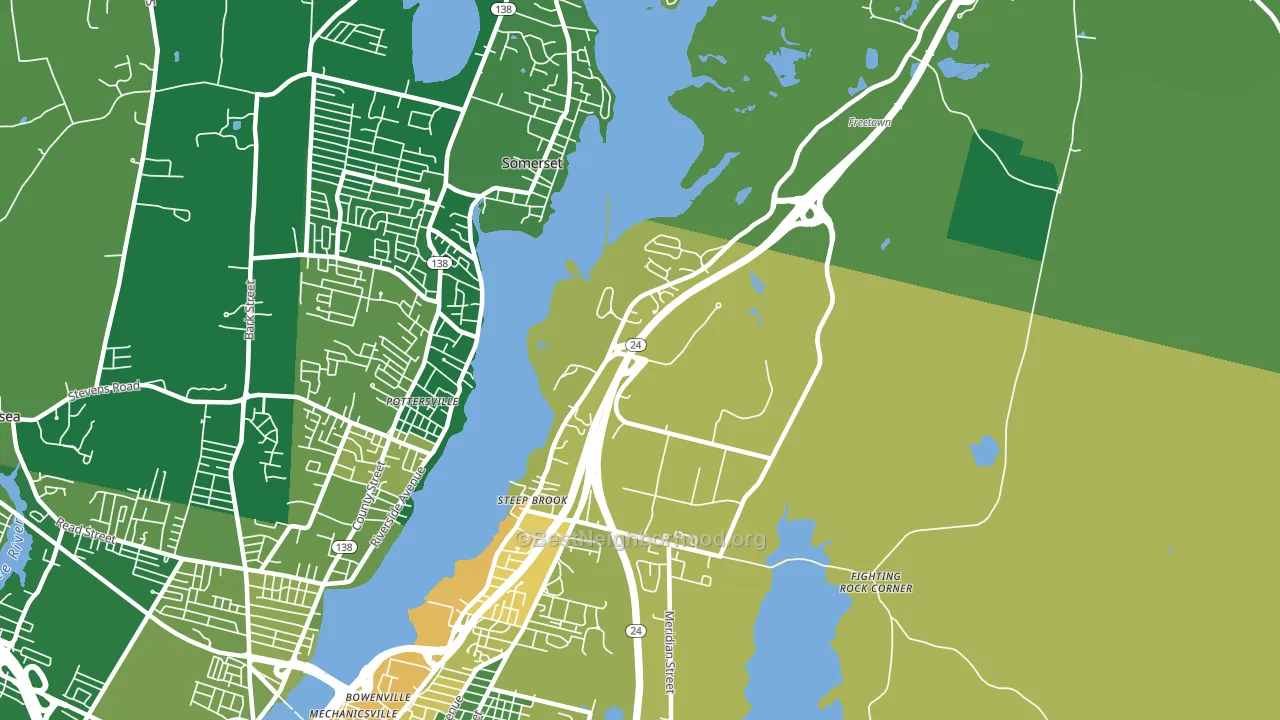
About 69% of adults in Steep Brook typically vote, above the U.S. average of about 62%. Among adults in Steep Brook, ~35% vote Democratic, ~35% Republican, and ~30% don't vote. The map below shows estimated turnout by block group.
How Steep Brook compares
Among neighborhoods within 5 miles, Steep Brook sits roughly in the middle of the political spectrum, with 2 neighbors leaning further in the place's direction and 3 leaning the other way.
Steep Brook runs about 25 points more Republican than Massachusetts as a whole.
Politics vary noticeably by block within Steep Brook. The northeast side runs the most Democratic (D+8) and the southwest side runs the most Republican (R+10), a spread of about 18 points.
Why Steep Brook leans the way it does
This analysis examined 14,881 data points per neighborhood to find what predicts political lean and turnout. The items below are a few correlations that stood out for Steep Brook, not a ranked or complete list of what matters most.
Areas with a high white share and below-average college attainment vote Republican. In Steep Brook, about 81% of residents are non-Hispanic white, about 8 points above the U.S. average of 72%; about 25% of adults hold a bachelor's degree, about 24 points below the Massachusetts average of 49%.
Paved land cover and Republican lean
Places with little paved surface tend to lean Republican; Steep Brook, Fall River, MA sits in the bottom tenth nationally on this measure. Paved ground does not change how people vote; it mostly reflects how urban and built-up a place is.
Why turnout in Steep Brook looks the way it does
Turnout in Steep Brook sits close to the national pattern. Routine healthcare access, homeownership, education, and food security all land near their national averages here. Learn more about the findings and methodology on the political spectrum map.
Nearby Neighborhoods
- North End, Fall River, MA D+4
- Highlands-Providence, Fall River, MA R+4
- Lower Highlands, Fall River, MA D+10
- Flint Village, Fall River, MA Even
- Corky Row, Fall River, MA D+3
- Sandy Beach, Fall River, MA Even
- Maplewood, Fall River, MA R+6
- Whittenton, Taunton, MA Even
- Kent Corner, Riverside, RI D+5
- Kent Heights, East Providence, RI D+7
Neighborhoods with Similar Populations
- New Horizons, Santa Ana, CA D+33
- Old Naples, Naples, FL R+14
- Sardis Woods, Charlotte, NC D+14
- Jefferson Square, Omaha, NE D+43
- Glenview, Oakland, CA D+79
- Canaryville, Chicago, IL R+3
- Roosevelt, Seattle, WA D+77
- NE-Sterling, San Bernardino, CA D+21
- Ridgeview-Webster, San Diego, CA D+37
- Takoma Park, Washington, DC D+84
Sources and methodology
Precinct-level voting records used to fit the model come from Massachusetts Secretary of the Commonwealth, Elections, distributed by the Voting and Election Science Team. Demographic inputs come from the U.S. Census Bureau (ACS 5-year estimates and the 2020 Decennial Census). Health and environmental inputs come from the CDC (PLACES and the Environmental Justice Index). Land cover comes from the USGS and EPA. Election-day and lead-up weather come from PRISM 4km daily grids and the NOAA Global Historical Climatology Network. Mail-voting and election-administration patterns come from the MIT Election Lab's Survey of the Performance of American Elections. Block-group crime detail comes from CrimeGrade. Internet data and modeling support provided by ISPreports.org.
Modeling and analysis by the BestNeighborhood data science team. Full methodology and findings: political spectrum map.
Methodology reviewed by the BestNeighborhood data team. Last updated May 2026.