Madrona is a Democratic stronghold. About 92% of voters here vote Democratic and 8% Republican.
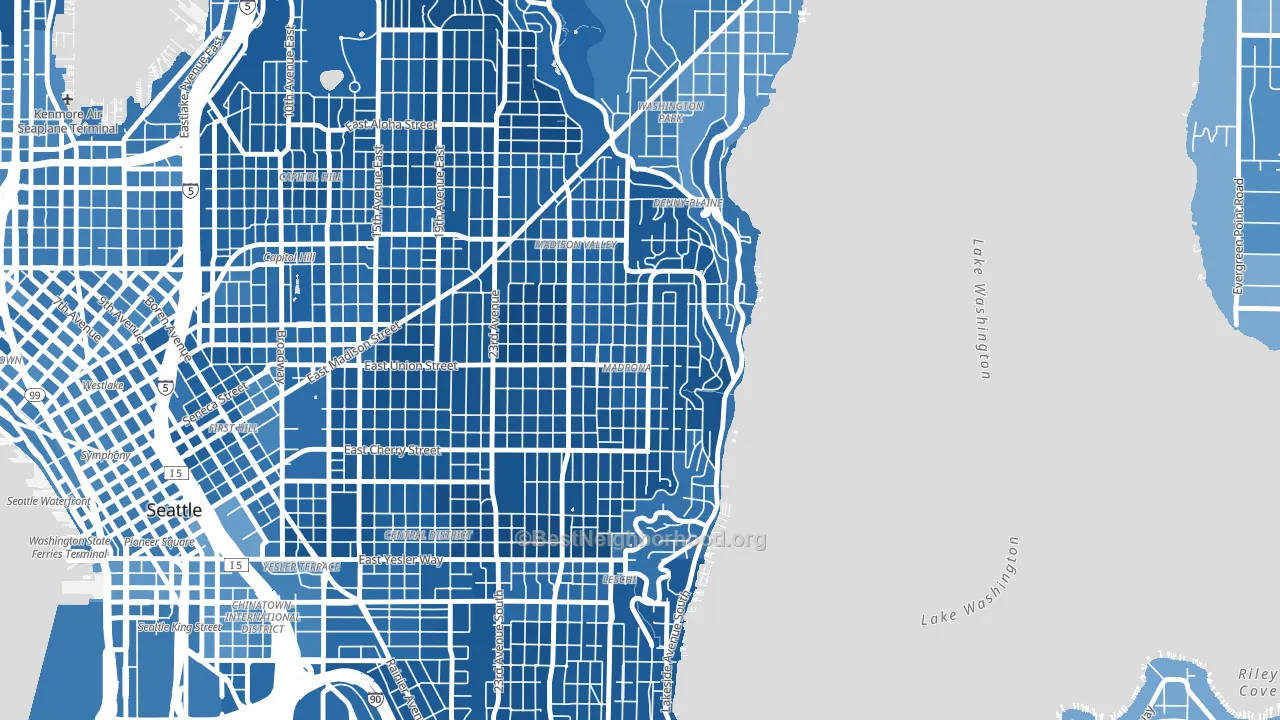
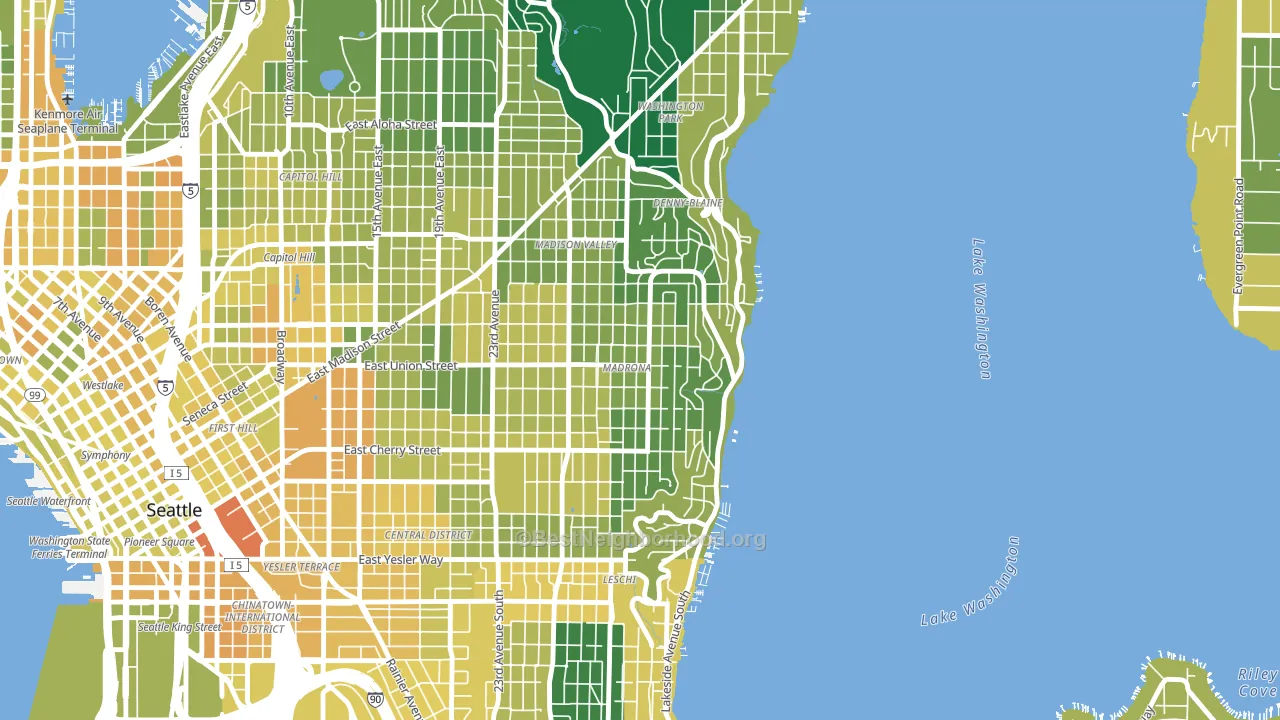
About 79% of adults in Madrona typically vote, above the U.S. average of about 62%. Among adults in Madrona, ~73% vote Democratic, ~6% Republican, and ~21% don't vote. The map below shows estimated turnout by block group.
How Madrona compares
Among neighborhoods within 5 miles, Madrona is the most Democratic-leaning.
Madrona runs about 66 points more Democratic than Washington as a whole.
Why Madrona leans the way it does
This analysis examined 14,881 data points per neighborhood to find what predicts political lean and turnout. The items below are a few correlations that stood out for Madrona, not a ranked or complete list of what matters most.
Areas with high college attainment vote Democratic. About 73% of adults in Madrona hold a bachelor's degree, about 45 points above the U.S. average of 28%.
Population density and Democratic lean
Places with high population density tend to lean Democratic; Madrona, Seattle, WA sits in the top quarter nationally on this measure.
Why turnout in Madrona looks the way it does
Areas with strong routine healthcare access turn out at higher rates. Madrona is in the top quarter nationally for routine-care measures such as insurance coverage, preventive screenings, and dental visits. The dental-visit rate here is about 77%, about 17 points above the U.S. average of 60%. Learn more about the findings and methodology on the political spectrum map.
Nearby Neighborhoods
- Central District, Seattle, WA D+80
- Leschi, Seattle, WA D+78
- Capitol Hill, Seattle, WA D+79
- Atlantic, Seattle, WA D+73
- Madison Park, Seattle, WA D+68
- First Hill, Seattle, WA D+69
- Downtown Seattle, Seattle, WA D+53
- International District, Seattle, WA D+61
- Montlake, Seattle, WA D+83
- Pioneer Square, Seattle, WA D+58
Neighborhoods with Similar Populations
- Eagle Bay, Kissimmee, FL D+11
- Castle Rouge, Detroit, MI D+82
- Golden Triangle, Denver, CO D+60
- Buechel, Louisville, KY D+31
- Hawthorne, Middle River, MD D+24
- Kirtland Community, Albuquerque, NM D+35
- Castle Ranch, Bakersfield, CA R+7
- University Heights and Rosedale Hills, Indianapolis, IN D+13
- Ypsilanti Historic District, Ypsilanti, MI D+65
- East Community Team South, Kansas City, MO D+61
Sources and methodology
Precinct-level voting records used to fit the model come from Washington Secretary of State, Elections, distributed by the Voting and Election Science Team. Demographic inputs come from the U.S. Census Bureau (ACS 5-year estimates and the 2020 Decennial Census). Health and environmental inputs come from the CDC (PLACES and the Environmental Justice Index). Land cover comes from the USGS and EPA. Election-day and lead-up weather come from PRISM 4km daily grids and the NOAA Global Historical Climatology Network. Mail-voting and election-administration patterns come from the MIT Election Lab's Survey of the Performance of American Elections. Block-group crime detail comes from CrimeGrade. Internet data and modeling support provided by ISPreports.org.
Modeling and analysis by the BestNeighborhood data science team. Full methodology and findings: political spectrum map.
Methodology reviewed by the BestNeighborhood data team. Last updated May 2026.