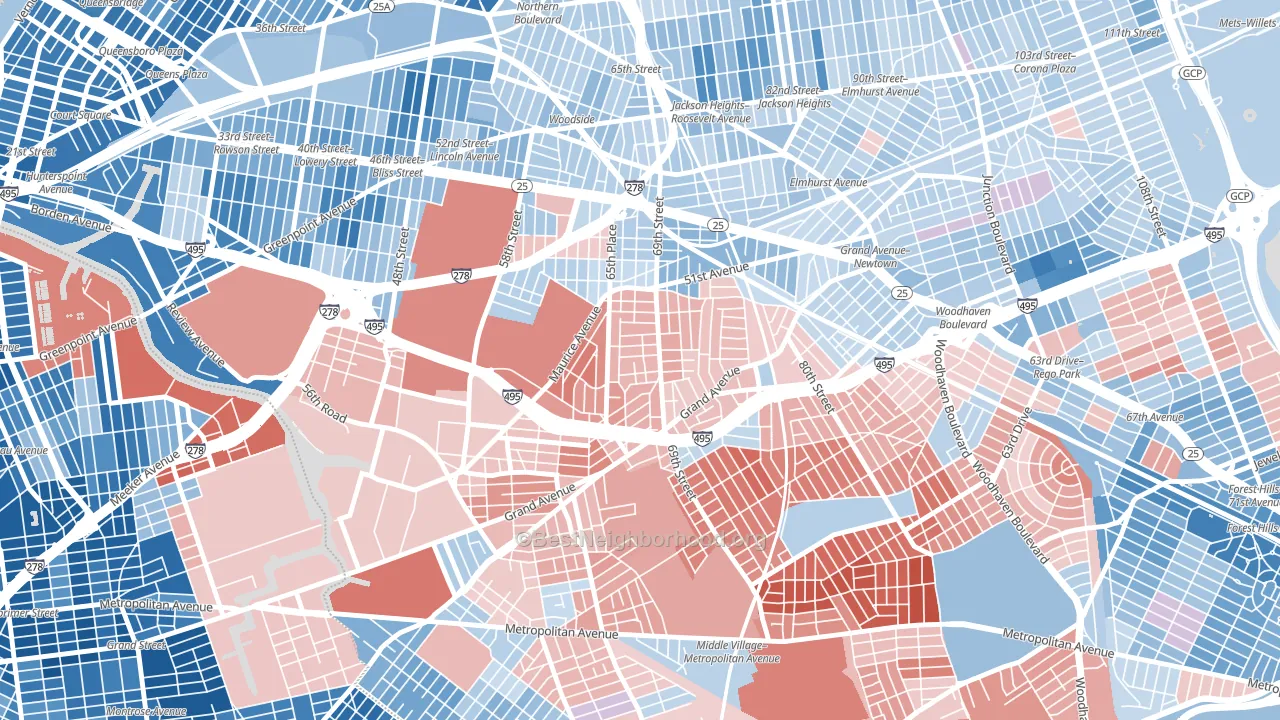
Maspeth leans slightly Republican by roughly 8 points: about 46% of voters vote Democratic and 54% Republican.
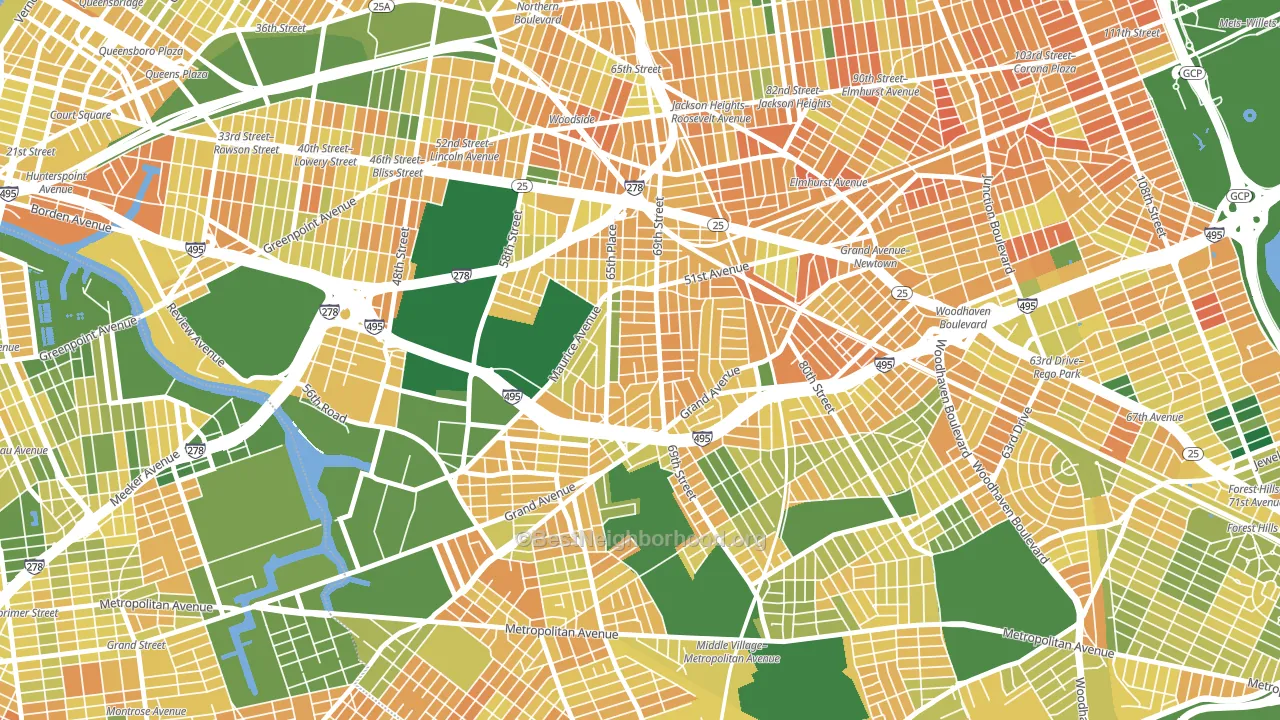
About 41% of adults in Maspeth typically vote, below the U.S. average of about 62%. Among adults in Maspeth, ~19% vote Democratic, ~22% Republican, and ~59% don't vote. The map below shows estimated turnout by block group.
How Maspeth compares
Among neighborhoods within 5 miles, Maspeth leans more Republican than 38 of 40 neighbors.
Maspeth runs about 21 points more Republican than New York as a whole. New York leans Democratic overall, while Maspeth is one of the few Republican-leaning pockets.
Politics vary noticeably by block within Maspeth. The west side runs the most Democratic (D+8) and the south side runs the most Republican (R+20), a spread of about 28 points.
Why Maspeth leans the way it does
This analysis examined 14,881 data points per neighborhood to find what predicts political lean and turnout. The items below are a few correlations that stood out for Maspeth, not a ranked or complete list of what matters most.
Maspeth votes Republican even though it is densely developed (more than 99%, far above the New York average of 36%). State and regional patterns outweigh the Democratic lean that density usually predicts here. Maspeth runs against the grain of New York, a Republican-leaning pocket in a Democratic-leaning state.
Paved land cover and Democratic lean
Places with extensive paved surfaces tend to lean Democratic; Maspeth, Queens, NY sits in the top tenth nationally on this measure. Paved ground does not change how people vote; it mostly reflects how urban and built-up a place is.
Why turnout in Maspeth looks the way it does
Crowded housing lines up with lower turnout. About 8% of homes in Maspeth have more than one occupant per room, above 87% of neighborhoods. Learn more about the findings and methodology on the political spectrum map.
Nearby Neighborhoods
- Woodside, Queens, NY D+15
- Middle Village, Queens, NY R+22
- Elmhurst, Queens, NY D+9
- Sunnyside, Queens, NY D+36
- Ridgewood, Queens, NY D+20
- Jackson Heights-ny, Queens, NY D+18
- Rego Park, Queens, NY D+4
- Glendale, Queens, NY R+8
- Corona, Queens, NY D+14
- Forest Hills, Queens, NY D+20
Neighborhoods with Similar Populations
- Riverview West, Santa Ana, CA D+5
- Hollywood Hills, Los Angeles, CA D+57
- Southside, Lansing, MI D+38
- Edenvale-Seven Trees, San Jose, CA D+28
- Southeast Boise, Boise, ID D+17
- Charleston Heights, Las Vegas, NV D+15
- Ocean Hill, Brooklyn, NY D+79
- Wolf Creek, Dallas, TX D+72
- River Oaks, Houston, TX D+11
- Park, Stockton, CA D+26
Sources and methodology
Precinct-level voting records used to fit the model come from New York State Board of Elections, distributed by the Voting and Election Science Team. Demographic inputs come from the U.S. Census Bureau (ACS 5-year estimates and the 2020 Decennial Census). Health and environmental inputs come from the CDC (PLACES and the Environmental Justice Index). Land cover comes from the USGS and EPA. Election-day and lead-up weather come from PRISM 4km daily grids and the NOAA Global Historical Climatology Network. Mail-voting and election-administration patterns come from the MIT Election Lab's Survey of the Performance of American Elections. Block-group crime detail comes from CrimeGrade. Internet data and modeling support provided by ISPreports.org.
Modeling and analysis by the BestNeighborhood data science team. Full methodology and findings: political spectrum map.
Methodology reviewed by the BestNeighborhood data team. Last updated May 2026.