Mount Washington is a Democratic stronghold. About 79% of voters here vote Democratic and 21% Republican.
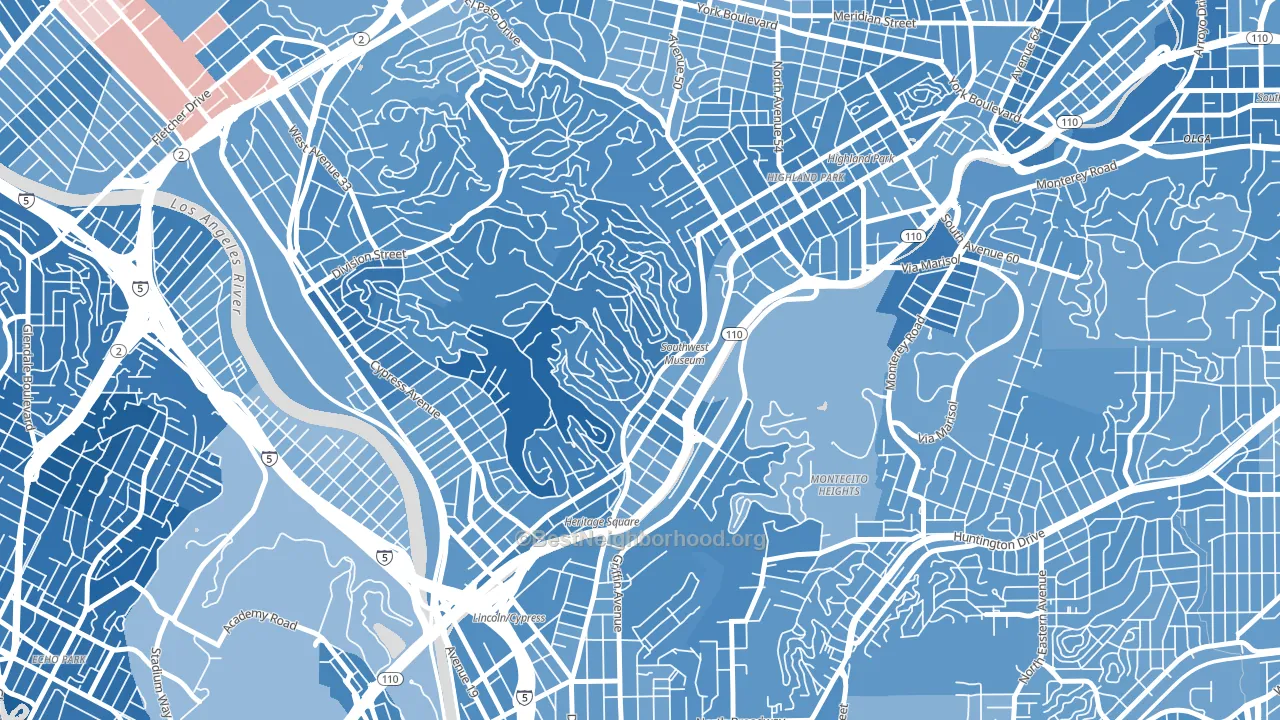
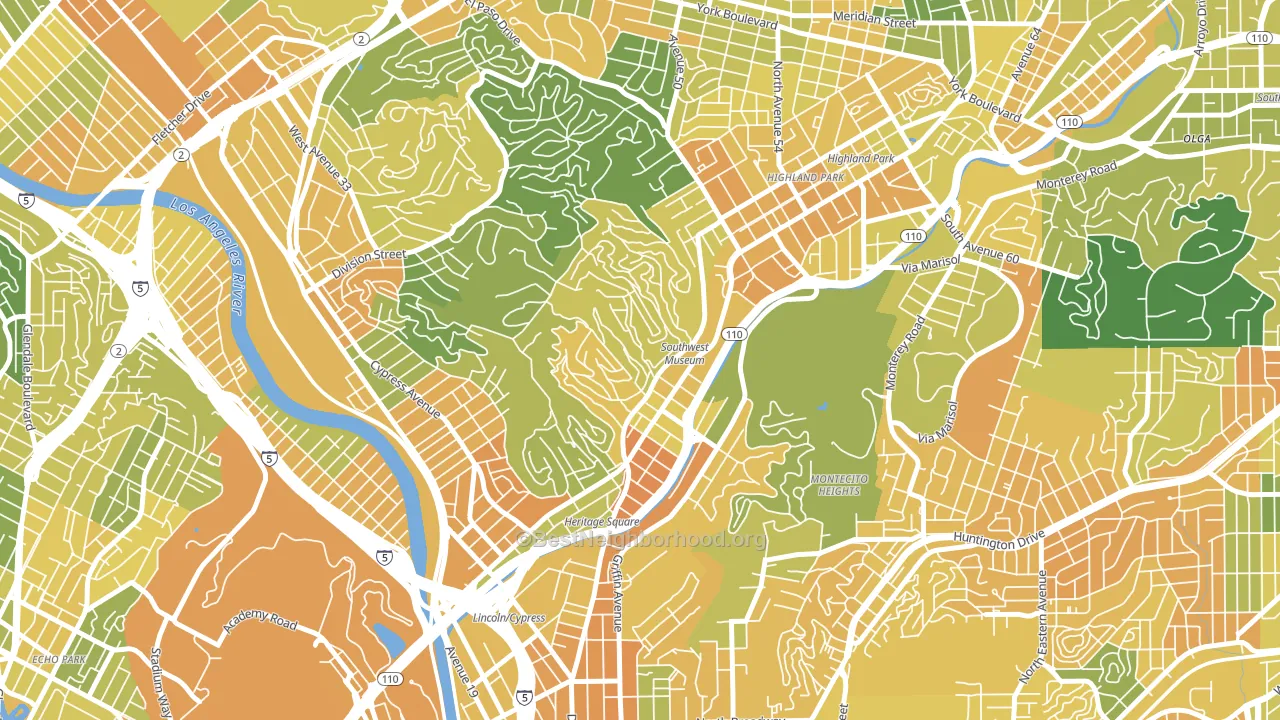
About 46% of adults in Mount Washington typically vote, below the U.S. average of about 62%. Among adults in Mount Washington, ~36% vote Democratic, ~10% Republican, and ~54% don't vote. The map below shows estimated turnout by block group.
How Mount Washington compares
Among neighborhoods within 5 miles, Mount Washington leans more Democratic than 28 of 35 neighbors.
Mount Washington runs about 37 points more Democratic than California as a whole.
Politics vary noticeably by block within Mount Washington. The west side is the most Democratic-leaning (D+71) and the south side is the least Democratic-leaning (D+40), a spread of about 30 points.
Why Mount Washington leans the way it does
Density, race composition, education, and family structure all sit close to their national averages in Mount Washington. The lean here lands roughly where demographic data alone would predict.
Cancer-screening access and voter turnout
Places with low colon-cancer-screening access tend to turn out at a lower rate; Mount Washington, Los Angeles, CA sits in the bottom tenth nationally on this measure. Cancer screening does not drive turnout; it reflects income, insurance, and healthcare access.
Why turnout in Mount Washington looks the way it does
Crowded housing lines up with lower turnout. About 11% of homes in Mount Washington have more than one occupant per room, above 92% of neighborhoods. Low high-school completion lines up with lower turnout, and about 74% of adults in Mount Washington have completed high school, below 92% of neighborhoods. Learn more about the findings and methodology on the political spectrum map.
Nearby Neighborhoods
- Cypress Park, Los Angeles, CA D+51
- Montecito Heights, Los Angeles, CA D+42
- Highland Park, Los Angeles, CA D+52
- Glassell Park, Los Angeles, CA D+48
- Lincoln Heights, Los Angeles, CA D+53
- Eagle Rock, Los Angeles, CA D+49
- El Sereno, Los Angeles, CA D+43
- Echo Park, Los Angeles, CA D+60
- Chinatown, Los Angeles, CA D+36
- Adams Hill, Glendale, CA D+25
Neighborhoods with Similar Populations
- Wedgewood, Charlotte, NC D+66
- Southwest Detroit, Detroit, MI D+28
- University City North, Charlotte, NC D+56
- Barton Hills, Austin, TX D+48
- Ysleta Mission Valley, El Paso, TX D+24
- Bella Vista, Philadelphia, PA D+76
- Reservoir, Newport News, VA D+42
- Chelsea, Atlantic City, NJ D+12
- Mid Central, Pasadena, CA D+51
- Old San Leandro, San Leandro, CA D+50
Sources and methodology
Precinct-level voting records used to fit the model come from California Secretary of State, Elections, distributed by the Voting and Election Science Team. Demographic inputs come from the U.S. Census Bureau (ACS 5-year estimates and the 2020 Decennial Census). Health and environmental inputs come from the CDC (PLACES and the Environmental Justice Index). Land cover comes from the USGS and EPA. Election-day and lead-up weather come from PRISM 4km daily grids and the NOAA Global Historical Climatology Network. Mail-voting and election-administration patterns come from the MIT Election Lab's Survey of the Performance of American Elections. Block-group crime detail comes from CrimeGrade. Internet data and modeling support provided by ISPreports.org.
Modeling and analysis by the BestNeighborhood data science team. Full methodology and findings: political spectrum map.
Methodology reviewed by the BestNeighborhood data team. Last updated May 2026.