Near North Side is a Democratic stronghold. About 76% of voters here vote Democratic and 24% Republican.
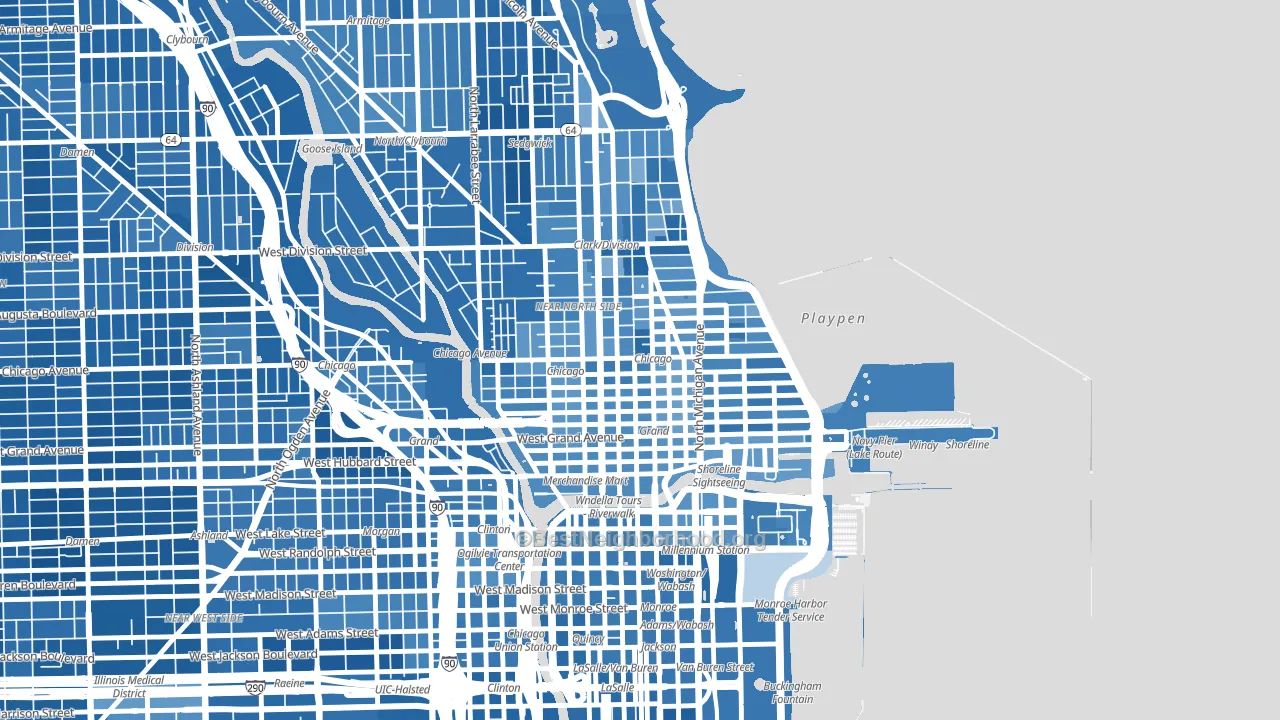
About 55% of adults in Near North Side typically vote, below the U.S. average of about 62%. Among adults in Near North Side, ~42% vote Democratic, ~13% Republican, and ~45% don't vote. The map below shows estimated turnout by block group.
How Near North Side compares
Among neighborhoods within 5 miles, Near North Side leans more Democratic than 5 of 34 neighbors.
Near North Side runs about 42 points more Democratic than Illinois as a whole.
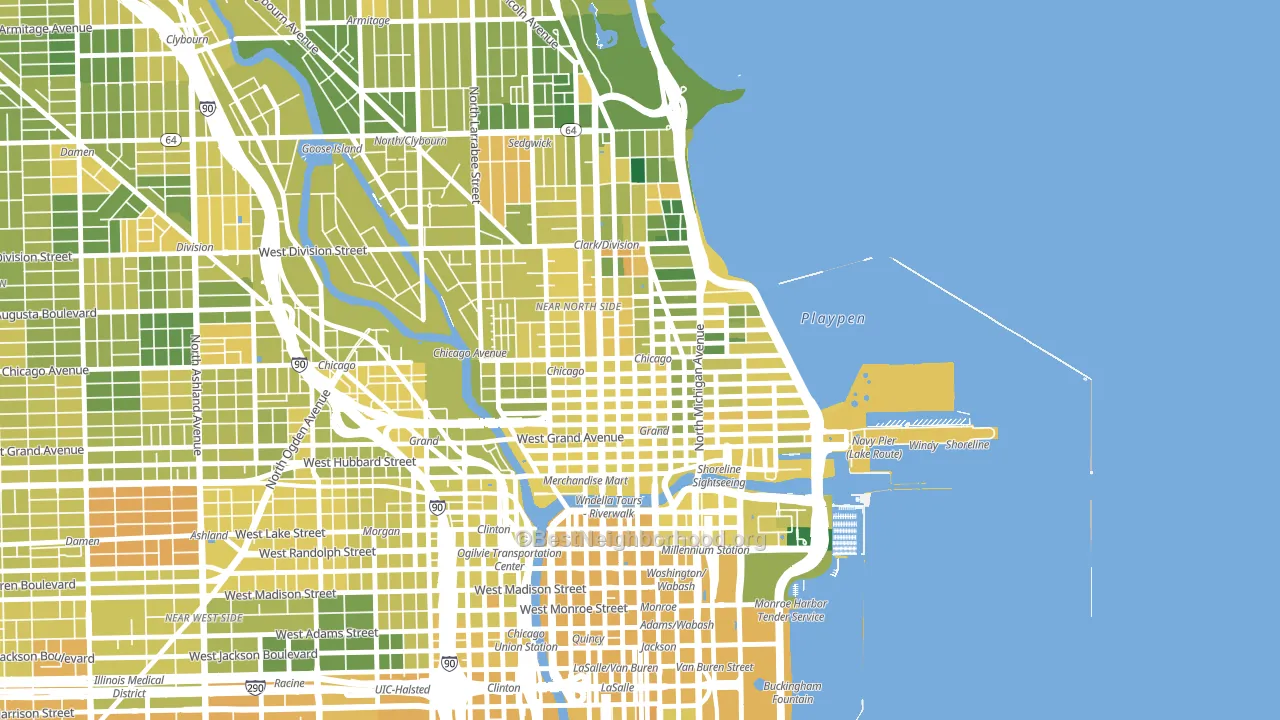
Politics vary noticeably by block within Near North Side. The northwest side is the most Democratic-leaning (D+65) and the south side is the least Democratic-leaning (D+47), a spread of about 18 points.
Why Near North Side leans the way it does
This analysis examined 14,881 data points per neighborhood to find what predicts political lean and turnout. The items below are a few correlations that stood out for Near North Side, not a ranked or complete list of what matters most.
Areas with high college attainment vote Democratic. About 84% of adults in Near North Side hold a bachelor's degree, about 56 points above the U.S. average of 28%. A high never-married share predicts Democratic voting, and about 56% of adults in Near North Side have never been married, above 89% of neighborhoods.
Walkability and Democratic lean
Places with a highly walkable street grid tend to lean Democratic; Near North Side, Chicago, IL sits in the top tenth nationally on this measure. A walkable street grid does not change how people vote; it mostly reflects how urban a place is.
Why turnout in Near North Side looks the way it does
Renters vote less often than owners. About 66% of households in Near North Side rent, about 41 points above the U.S. average of 25%. Strong routine healthcare access lines up with higher turnout, and Near North Side sits in the top quarter on routine-care measures. Learn more about the findings and methodology on the political spectrum map.
Nearby Neighborhoods
- Gold Coast, Chicago, IL D+54
- Loop, Chicago, IL D+57
- Belgravia Terrace, Chicago, IL D+58
- Greektown, Chicago, IL D+59
- Printers Row, Chicago, IL D+69
- Near West Side, Chicago, IL D+68
- Lincoln Park, Chicago, IL D+62
- West Town, Chicago, IL D+69
- University Village, Chicago, IL D+67
- Near South Side, Chicago, IL D+70
Neighborhoods with Similar Populations
- Cambrian Park, San Jose, CA D+28
- Ahwatukee, Phoenix, AZ D+6
- White Haven-Coro Lake, Memphis, TN D+83
- Northwest, Virginia Beach, VA D+17
- North Long Beach, Long Beach, CA D+39
- Mid Wilshire, Los Angeles, CA D+47
- East End, Houston, TX D+31
- Ewa, Ewa Beach, HI D+6
- Cordova-Appling, Cordova, TN D+30
- North Valley, San Jose, CA D+27
Sources and methodology
Precinct-level voting records used to fit the model come from Illinois State Board of Elections, distributed by the Voting and Election Science Team. Demographic inputs come from the U.S. Census Bureau (ACS 5-year estimates and the 2020 Decennial Census). Health and environmental inputs come from the CDC (PLACES and the Environmental Justice Index). Land cover comes from the USGS and EPA. Election-day and lead-up weather come from PRISM 4km daily grids and the NOAA Global Historical Climatology Network. Mail-voting and election-administration patterns come from the MIT Election Lab's Survey of the Performance of American Elections. Block-group crime detail comes from CrimeGrade. Internet data and modeling support provided by ISPreports.org.
Modeling and analysis by the BestNeighborhood data science team. Full methodology and findings: political spectrum map.
Methodology reviewed by the BestNeighborhood data team. Last updated May 2026.