University Village is a Democratic stronghold. About 83% of voters here vote Democratic and 17% Republican.
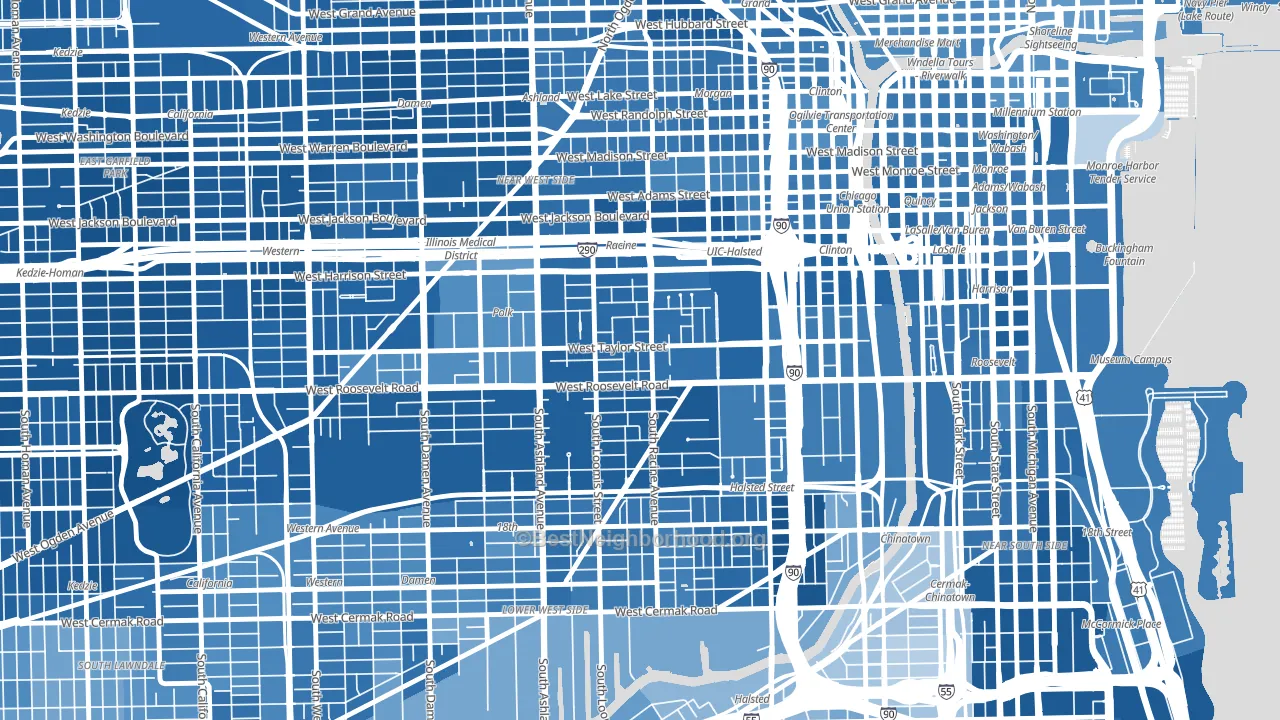
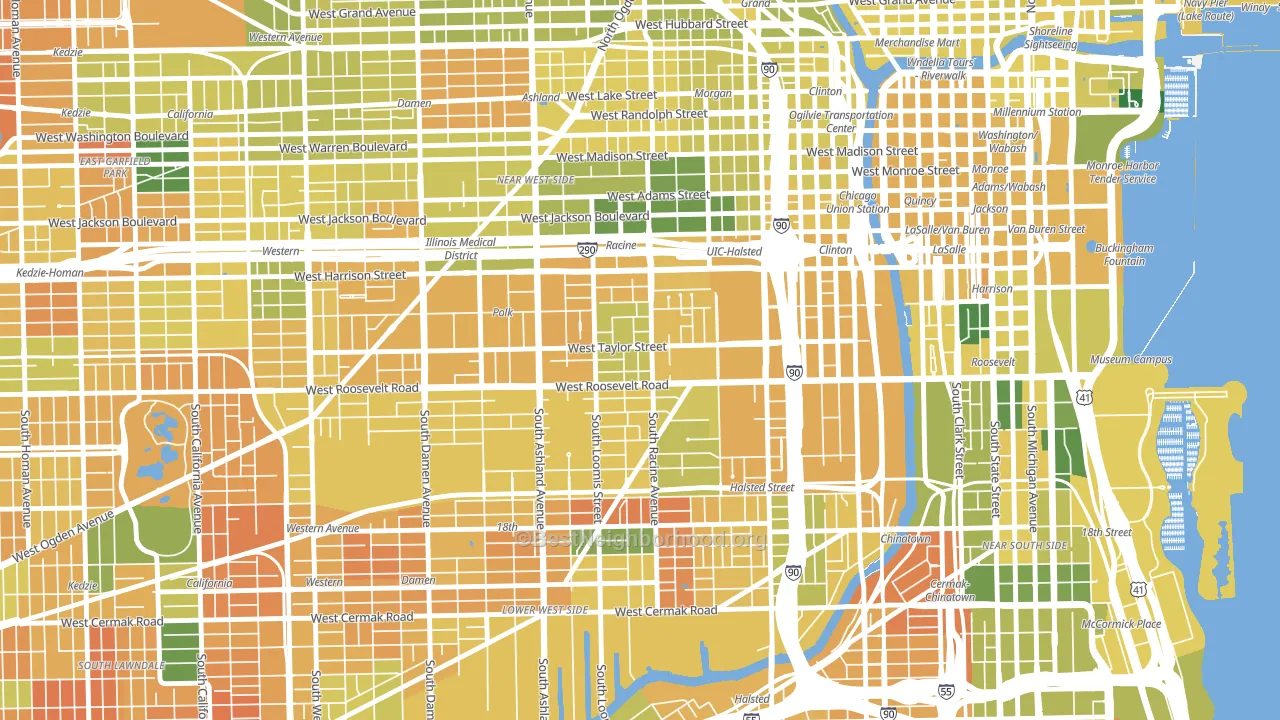
About 48% of adults in University Village typically vote, below the U.S. average of about 62%. Among adults in University Village, ~40% vote Democratic, ~8% Republican, and ~52% don't vote. The map below shows estimated turnout by block group.
How University Village compares
Among neighborhoods within 5 miles, University Village leans more Democratic than 25 of 42 neighbors.
University Village runs about 56 points more Democratic than Illinois as a whole.
Politics vary noticeably by block within University Village. The south side is the most Democratic-leaning (D+76) and the northeast side is the least Democratic-leaning (D+56), a spread of about 20 points.
Why University Village leans the way it does
This analysis examined 14,881 data points per neighborhood to find what predicts political lean and turnout. The items below are a few correlations that stood out for University Village, not a ranked or complete list of what matters most.
Areas with high college attainment vote Democratic. About 66% of adults in University Village hold a bachelor's degree, about 38 points above the U.S. average of 28%. Density combined with diversity predicts Democratic voting, and non-Hispanic white share in University Village is about 34%, about 39 points below the U.S. average of 72%. A high never-married share predicts Democratic voting, and about 64% of adults in University Village have never been married, above 96% of neighborhoods.
Population density and Democratic lean
Places with high population density tend to lean Democratic; University Village, Chicago, IL sits in the top tenth nationally on this measure.
Why turnout in University Village looks the way it does
Renters vote less often than owners. About 67% of households in University Village rent, about 42 points above the U.S. average of 25%. Learn more about the findings and methodology on the political spectrum map.
Nearby Neighborhoods
- Near West Side, Chicago, IL D+68
- Pilsen, Chicago, IL D+62
- Greektown, Chicago, IL D+59
- Lower West Side, Chicago, IL D+58
- Claremont Cottages, Chicago, IL D+71
- Printers Row, Chicago, IL D+69
- Near South Side, Chicago, IL D+70
- Locks, Chicago, IL D+30
- Armour Square, Chicago, IL D+16
- Loop, Chicago, IL D+57
Neighborhoods with Similar Populations
- Wolf Pen Creek District, College Station, TX D+30
- Tolleston, Gary, IN D+82
- Toddville Road, Charlotte, NC D+64
- River Park, South Bend, IN D+21
- Mt Eden, Hayward, CA D+30
- Near Northeast, Syracuse, NY D+48
- Powderhorn Park, Minneapolis, MN D+73
- Southland Deerfield Open Gates, Lexington, KY D+30
- Broadview, Seattle, WA D+63
- Berkeley, Denver, CO D+64
Sources and methodology
Precinct-level voting records used to fit the model come from Illinois State Board of Elections, distributed by the Voting and Election Science Team. Demographic inputs come from the U.S. Census Bureau (ACS 5-year estimates and the 2020 Decennial Census). Health and environmental inputs come from the CDC (PLACES and the Environmental Justice Index). Land cover comes from the USGS and EPA. Election-day and lead-up weather come from PRISM 4km daily grids and the NOAA Global Historical Climatology Network. Mail-voting and election-administration patterns come from the MIT Election Lab's Survey of the Performance of American Elections. Block-group crime detail comes from CrimeGrade. Internet data and modeling support provided by ISPreports.org.
Modeling and analysis by the BestNeighborhood data science team. Full methodology and findings: political spectrum map.
Methodology reviewed by the BestNeighborhood data team. Last updated May 2026.