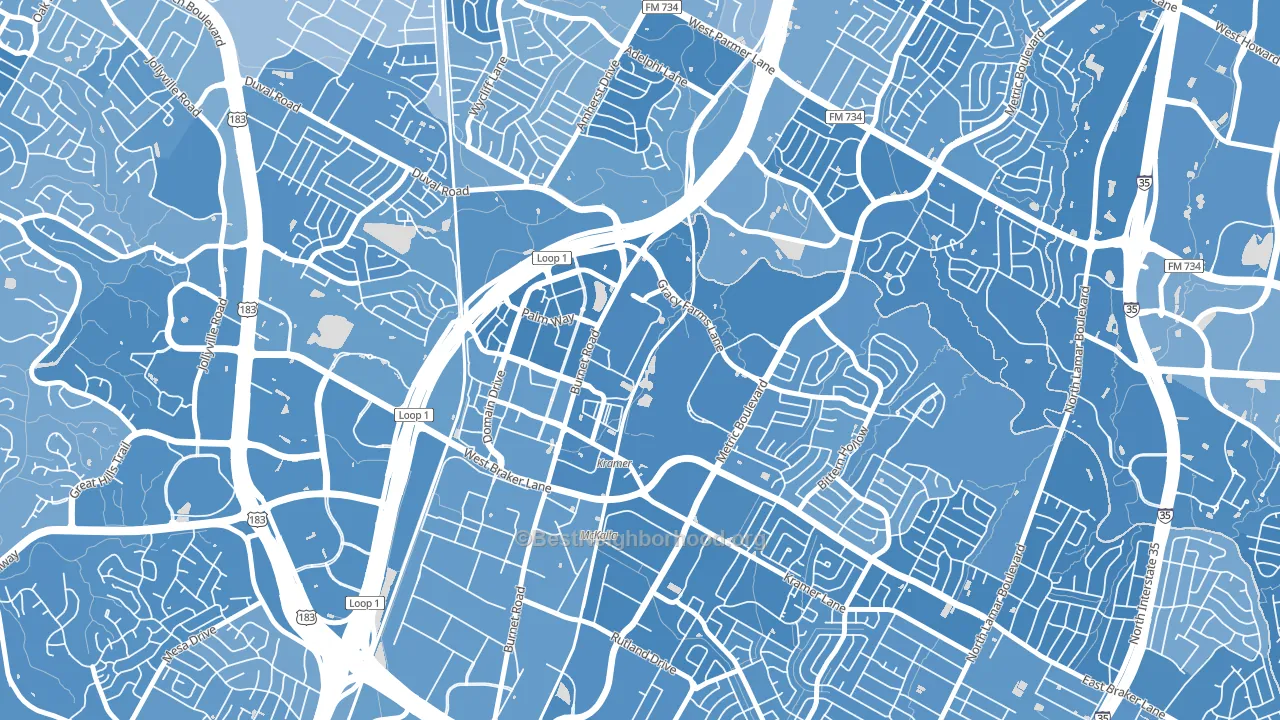
North Burnet leans heavily Democratic by roughly 44 points: about 72% of voters vote Democratic and 28% Republican.
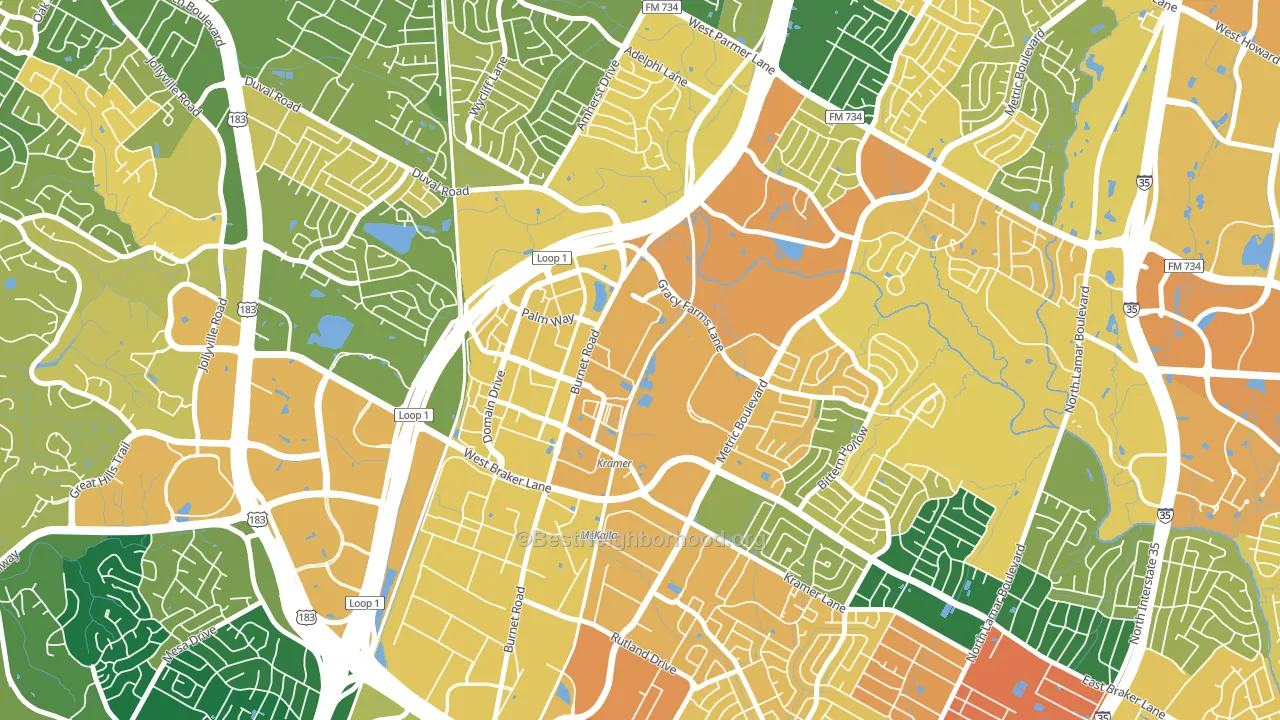
About 46% of adults in North Burnet typically vote, below the U.S. average of about 62%. Among adults in North Burnet, ~33% vote Democratic, ~13% Republican, and ~54% don't vote. The map below shows estimated turnout by block group.
How North Burnet compares
Among neighborhoods within 5 miles, North Burnet leans more Democratic than 3 of 13 neighbors.
North Burnet runs about 58 points more Democratic than Texas as a whole. Texas leans Republican overall, while North Burnet is one of the few Democratic-leaning pockets.
Politics vary noticeably by block within North Burnet. The northeast side is the most Democratic-leaning (D+49) and the southeast side is the least Democratic-leaning (D+35), a spread of about 14 points.
Why North Burnet leans the way it does
This analysis examined 14,881 data points per neighborhood to find what predicts political lean and turnout. The items below are a few correlations that stood out for North Burnet, not a ranked or complete list of what matters most.
North Burnet votes against the grain of Texas. Texas leans Republican overall, while North Burnet runs about 58 points more Democratic. High college attainment predicts Democratic voting, and North Burnet sits in the top quarter (about 64%, above 85% of neighborhoods). A high never-married share predicts Democratic voting, and about 58% of adults in North Burnet have never been married, above 92% of neighborhoods.
Renting and voter turnout
Places with renter-heavy households tend to turn out at a lower rate; North Burnet, Austin, TX sits in the top tenth nationally on this measure.
Why turnout in North Burnet looks the way it does
Renters vote less often than owners. About 88% of households in North Burnet rent, about 63 points above the U.S. average of 25%. Learn more about the findings and methodology on the political spectrum map.
Nearby Neighborhoods
- North Austin, Austin, TX D+48
- North Shoal Creek, Austin, TX D+51
- North Lamar, Austin, TX D+37
- Milwood, Austin, TX D+42
- Wooten, Austin, TX D+53
- Mesa Forest, Austin, TX D+44
- Georgian Acres, Austin, TX D+48
- Crestview, Austin, TX D+66
- Heritage Hills, Austin, TX D+47
- Windsor Hills, Austin, TX D+55
Neighborhoods with Similar Populations
- Sandtown-Southeastern Atlanta, Atlanta, GA D+84
- Belmont Heights, Long Beach, CA D+56
- salisbury, Allentown, PA R+2
- South Lowell, Lowell, MA D+19
- Chambersburg, Trenton, NJ D+39
- South Side, Columbus, OH D+50
- North Hills, El Paso, TX D+4
- Bergen Beach, Brooklyn, NY R+24
- Columbia City, Seattle, WA D+71
- Tottenville, Staten Island, NY R+62
Sources and methodology
Precinct-level voting records used to fit the model come from Texas Secretary of State, Elections Division, distributed by the Voting and Election Science Team. Demographic inputs come from the U.S. Census Bureau (ACS 5-year estimates and the 2020 Decennial Census). Health and environmental inputs come from the CDC (PLACES and the Environmental Justice Index). Land cover comes from the USGS and EPA. Election-day and lead-up weather come from PRISM 4km daily grids and the NOAA Global Historical Climatology Network. Mail-voting and election-administration patterns come from the MIT Election Lab's Survey of the Performance of American Elections. Block-group crime detail comes from CrimeGrade. Internet data and modeling support provided by ISPreports.org.
Modeling and analysis by the BestNeighborhood data science team. Full methodology and findings: political spectrum map.
Methodology reviewed by the BestNeighborhood data team. Last updated May 2026.