North Lawndale is a Democratic stronghold. About 89% of voters here vote Democratic and 11% Republican.
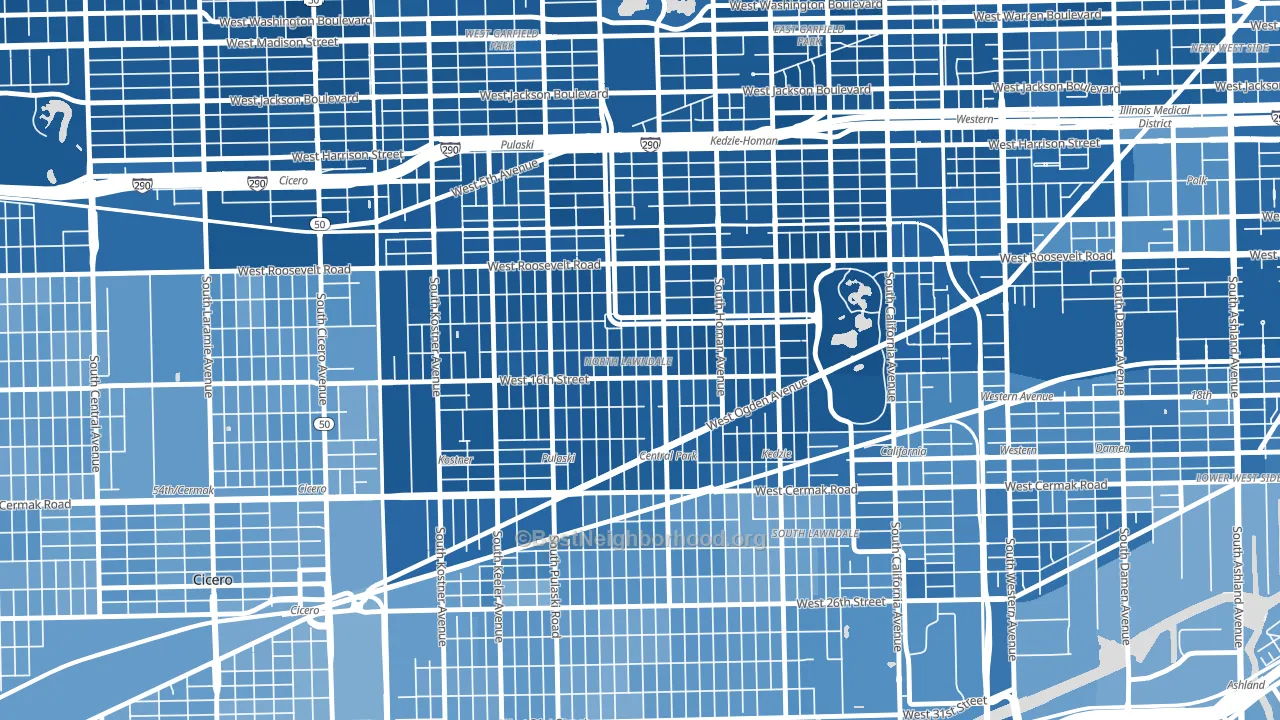
About 44% of adults in North Lawndale typically vote, below the U.S. average of about 62%. Among adults in North Lawndale, ~39% vote Democratic, ~5% Republican, and ~56% don't vote. The map below shows estimated turnout by block group.
How North Lawndale compares
Among neighborhoods within 5 miles, North Lawndale leans more Democratic than 37 of 42 neighbors.
North Lawndale runs about 67 points more Democratic than Illinois as a whole.
Why North Lawndale leans the way it does
This analysis examined 14,881 data points per neighborhood to find what predicts political lean and turnout. The items below are a few correlations that stood out for North Lawndale, not a ranked or complete list of what matters most.
Density combined with diversity predicts Democratic voting. Non-Hispanic white share in North Lawndale is about 4%, about 68 points below the U.S. average of 72%. A high never-married share predicts Democratic voting, and about 61% of adults in North Lawndale have never been married, above 94% of neighborhoods.
Preventive-care access and voter turnout
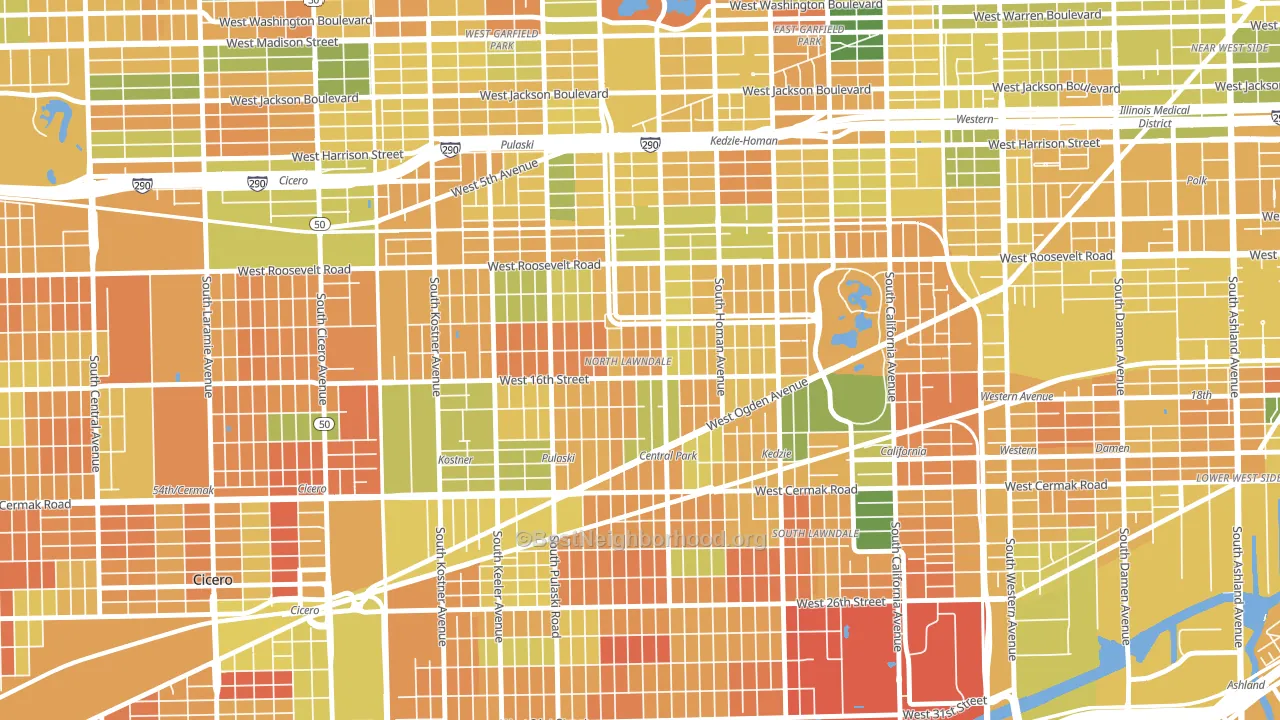
Places with limited routine preventive-care access tend to turn out at a lower rate; North Lawndale, Chicago, IL sits in the bottom tenth nationally on this measure. Dental visits do not drive turnout; the rate reflects income, insurance, and healthcare access, which line up with who votes.
Why turnout in North Lawndale looks the way it does
Areas with limited routine healthcare access turn out at lower rates. North Lawndale is in the bottom quarter nationally for routine-care measures such as insurance coverage, preventive screenings, and dental visits. The dental-visit rate here is about 41%, about 22 points below the Illinois average of 63%. Renters vote less often than owners, and about 73% of households in North Lawndale rent, about 48 points above the U.S. average of 25%. High food insecurity lines up with lower turnout, and about 47% of adults in North Lawndale report food insecurity, above 98% of neighborhoods. Learn more about the findings and methodology on the political spectrum map.
Nearby Neighborhoods
- West Garfield Park, Chicago, IL D+81
- South Lawndale, Chicago, IL D+41
- Bohemian California, Chicago, IL D+46
- Whiskey Point, Chicago, IL D+48
- Crawford, Chicago, IL D+38
- East Garfield Park, Chicago, IL D+79
- Central Park, Chicago, IL D+80
- Claremont Cottages, Chicago, IL D+71
- Mandell, Chicago, IL D+79
- Lower West Side, Chicago, IL D+58
Neighborhoods with Similar Populations
- Rhodes Ranch, Spring Valley, NV D+12
- Torresdale, Philadelphia, PA R+10
- Berryessa, San Jose, CA D+22
- Scripps Ranch, San Diego, CA D+20
- Ettingville, Staten Island, NY R+54
- West End, Tacoma, WA D+33
- Payne Phallen, St. Paul, MN D+40
- Carrollwood, Tampa, FL R+5
- Old Brooklyn, Cleveland, OH D+14
- Northwest, Reno, NV Even
Sources and methodology
Precinct-level voting records used to fit the model come from Illinois State Board of Elections, distributed by the Voting and Election Science Team. Demographic inputs come from the U.S. Census Bureau (ACS 5-year estimates and the 2020 Decennial Census). Health and environmental inputs come from the CDC (PLACES and the Environmental Justice Index). Land cover comes from the USGS and EPA. Election-day and lead-up weather come from PRISM 4km daily grids and the NOAA Global Historical Climatology Network. Mail-voting and election-administration patterns come from the MIT Election Lab's Survey of the Performance of American Elections. Block-group crime detail comes from CrimeGrade. Internet data and modeling support provided by ISPreports.org.
Modeling and analysis by the BestNeighborhood data science team. Full methodology and findings: political spectrum map.
Methodology reviewed by the BestNeighborhood data team. Last updated May 2026.