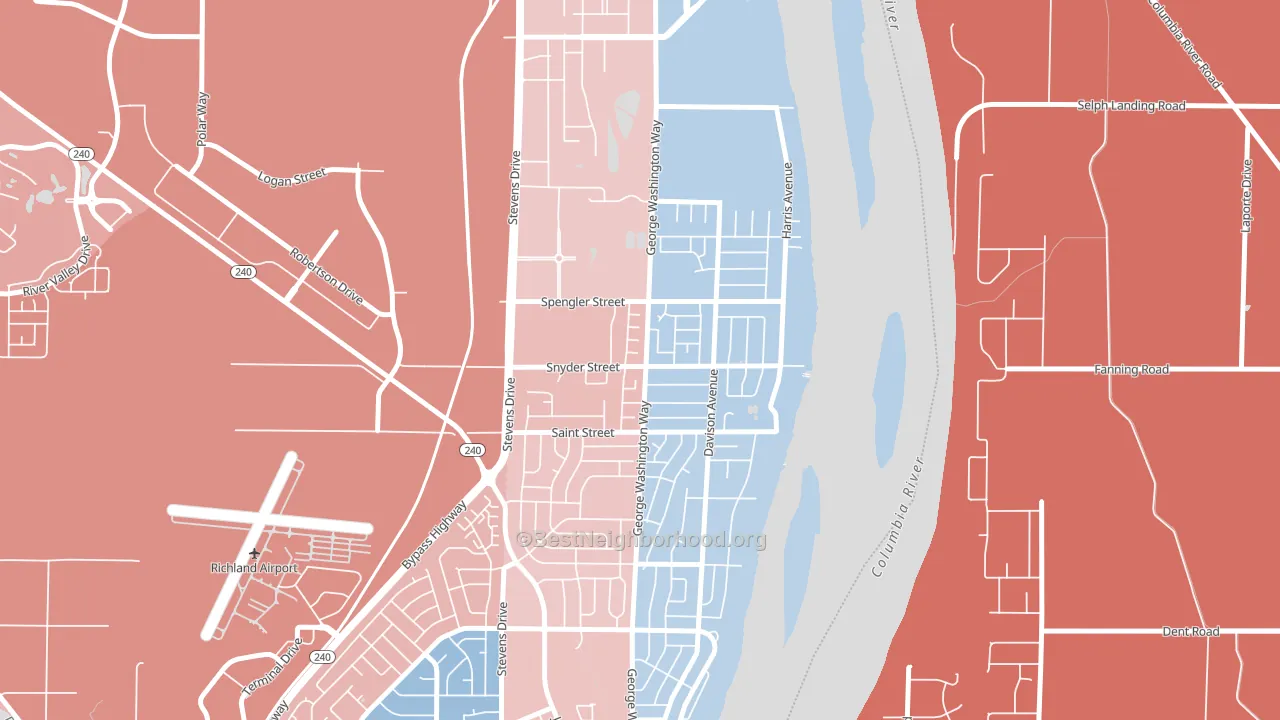
North Richland leans slightly Democratic by roughly 8 points: about 54% of voters vote Democratic and 46% Republican.
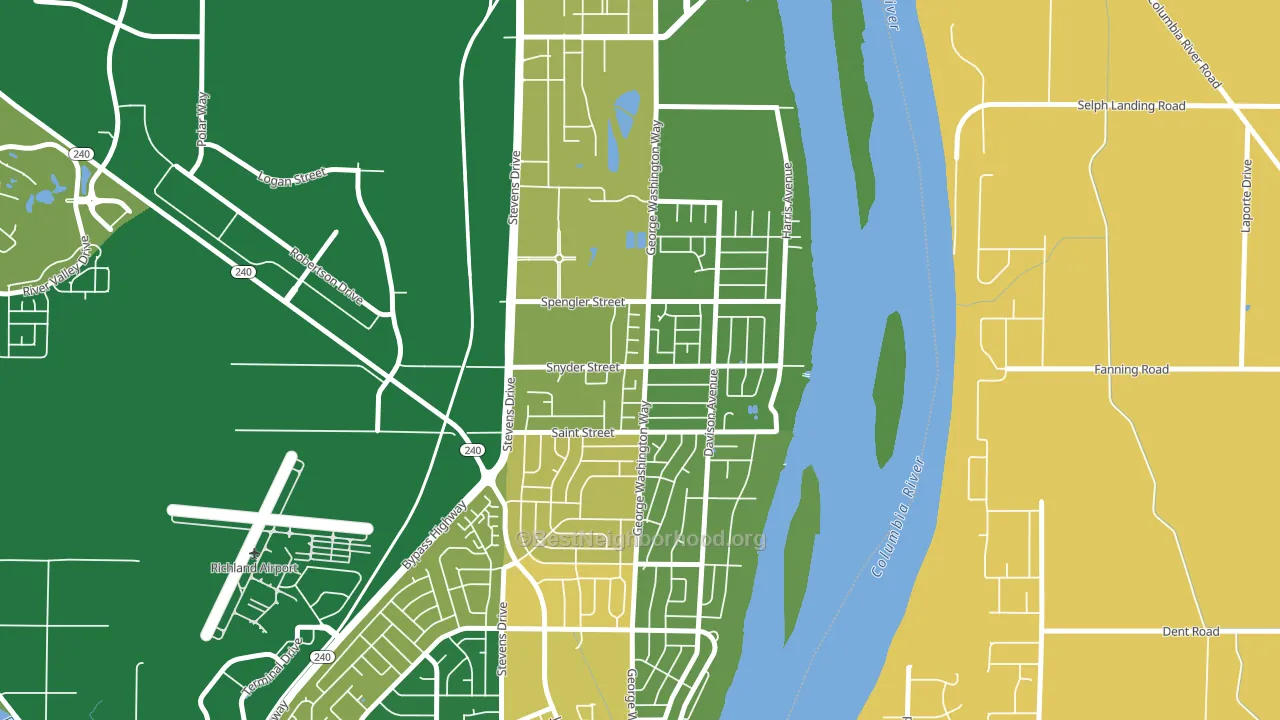
About 78% of adults in North Richland typically vote, above the U.S. average of about 62%. Among adults in North Richland, ~42% vote Democratic, ~36% Republican, and ~22% don't vote. The map below shows estimated turnout by block group.
How North Richland compares
Among neighborhoods within 5 miles, North Richland leans more Democratic than 2 of 3 neighbors.
North Richland runs about 9 points more Republican than Washington as a whole.
Politics vary noticeably by block within North Richland. The southeast side is the most Democratic-leaning (D+17) and the west side is the least Democratic-leaning (Even), a spread of about 17 points.
Why North Richland leans the way it does
Density, race composition, education, and family structure all sit close to their national averages in North Richland. The lean here lands roughly where demographic data alone would predict.
Developed land, local retail density, and voter turnout
Places that combine a rural land-use pattern and dense local retail within a mile tend to turn out at a higher rate, as North Richland, Richland, WA does.
Why turnout in North Richland looks the way it does
Areas with strong routine healthcare access turn out at higher rates. North Richland is in the top quarter nationally for routine-care measures such as insurance coverage, preventive screenings, and dental visits. The dental-visit rate here is about 67%, about 7 points above the U.S. average of 60%. Learn more about the findings and methodology on the political spectrum map.
Nearby Neighborhoods
- Gold Coast, Richland, WA D+10
- Stevens Triangle, Richland, WA R+4
- Lovisa Farms, Pasco, WA R+23
- Keene Valley, Richland, WA R+9
- Meadow Springs, Richland, WA R+7
- Creekstone, Kennewick, WA R+28
- Sun Willows, Pasco, WA D+13
- Sylvester Park, Pasco, WA D+17
- Downtown, Prosser, WA R+20
- Thorpe Westwood, Spokane, WA R+9
Neighborhoods with Similar Populations
- Jackson Heights, Mobile, AL D+10
- Willamette, Albany, OR D+2
- Wailea, Kihei, HI D+20
- Reedy Creek, Richmond, VA D+70
- Coytesville, Fort Lee, NJ D+17
- Yalecrest, Salt Lake City, UT D+61
- Boltons Landing, Charleston, SC D+7
- Wedge, Woodinville, WA D+36
- Cloutier Court, Wilmington, DE D+26
- Broadacres Homes, Athens, GA D+56
Sources and methodology
Precinct-level voting records used to fit the model come from Washington Secretary of State, Elections, distributed by the Voting and Election Science Team. Demographic inputs come from the U.S. Census Bureau (ACS 5-year estimates and the 2020 Decennial Census). Health and environmental inputs come from the CDC (PLACES and the Environmental Justice Index). Land cover comes from the USGS and EPA. Election-day and lead-up weather come from PRISM 4km daily grids and the NOAA Global Historical Climatology Network. Mail-voting and election-administration patterns come from the MIT Election Lab's Survey of the Performance of American Elections. Block-group crime detail comes from CrimeGrade. Internet data and modeling support provided by ISPreports.org.
Modeling and analysis by the BestNeighborhood data science team. Full methodology and findings: political spectrum map.
Methodology reviewed by the BestNeighborhood data team. Last updated May 2026.