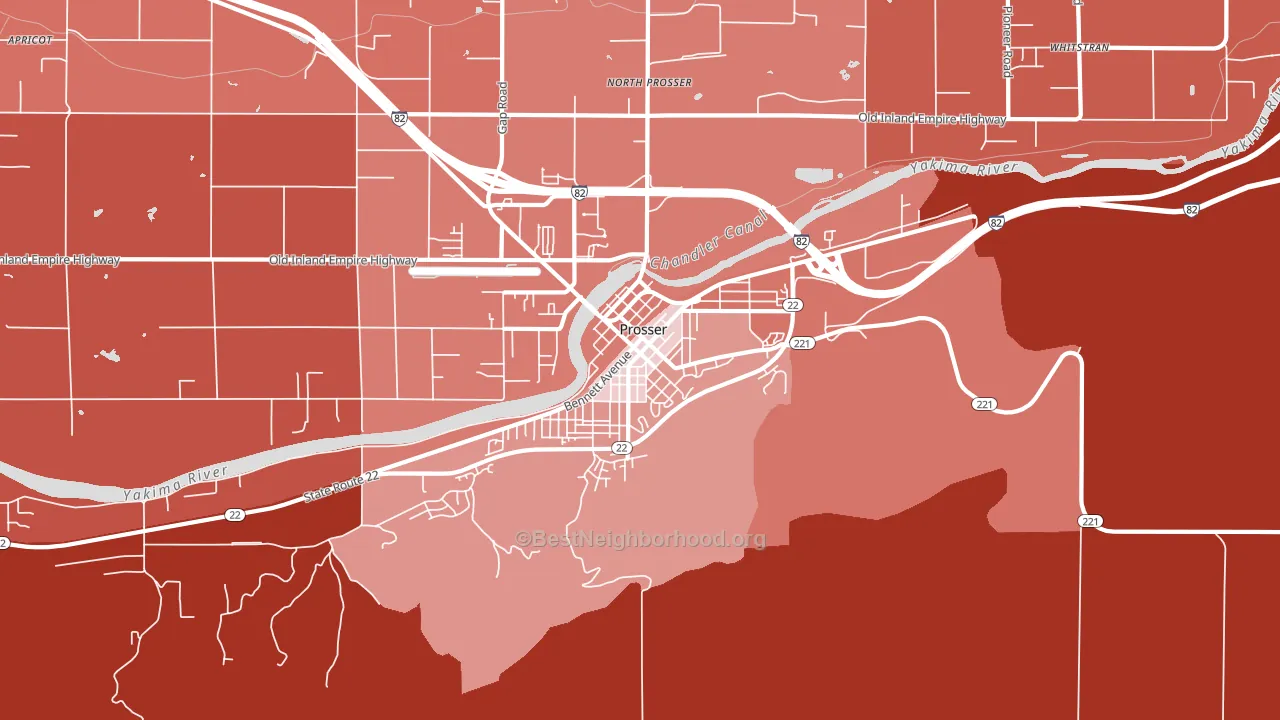
Downtown leans Republican by roughly 20 points: about 40% of voters vote Democratic and 60% Republican.
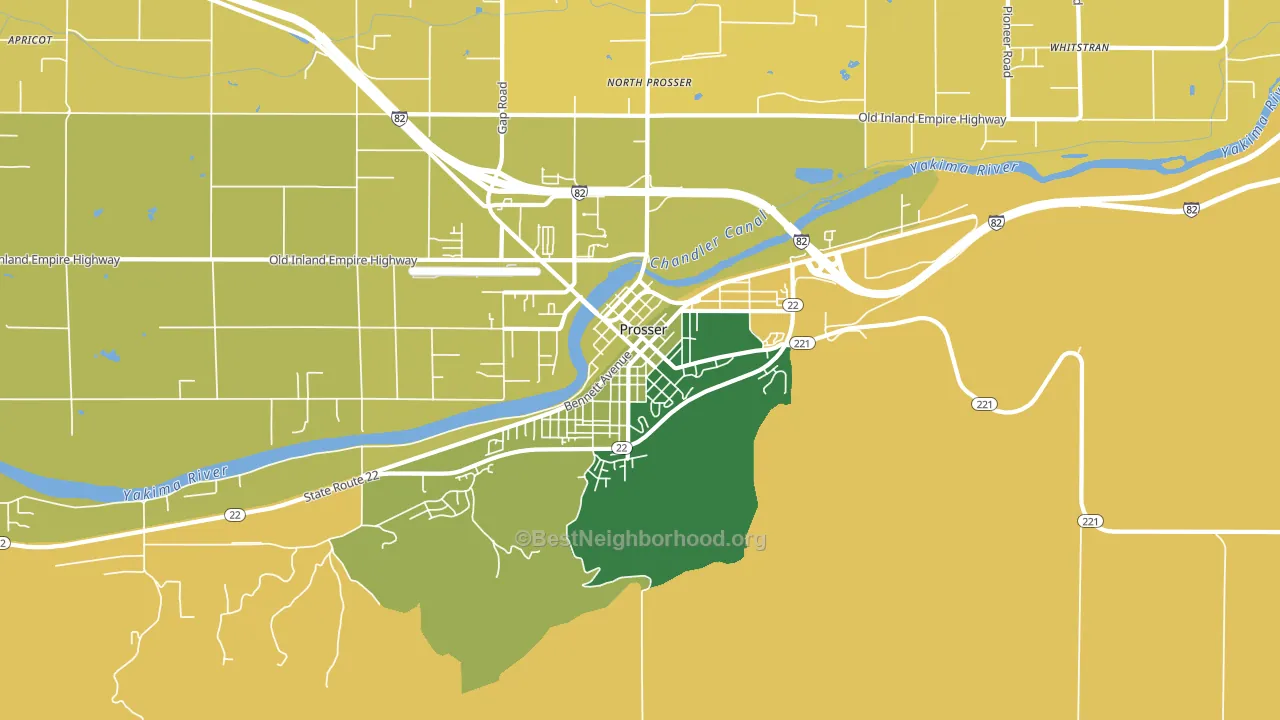
About 68% of adults in Downtown typically vote, above the U.S. average of about 62%. Among adults in Downtown, ~27% vote Democratic, ~41% Republican, and ~32% don't vote. The map below shows estimated turnout by block group.
How Downtown compares
Downtown runs about 39 points more Republican than Washington as a whole. Washington leans Democratic overall, while Downtown is one of the few Republican-leaning pockets.
Politics vary noticeably by block within Downtown. The west side is the most Republican-leaning (R+27) and the south side is the least Republican-leaning (R+12), a spread of about 15 points.
Why Downtown leans the way it does
This analysis examined 14,881 data points per neighborhood to find what predicts political lean and turnout. The items below are a few correlations that stood out for Downtown, not a ranked or complete list of what matters most.
Downtown votes against the grain of Washington. Washington leans Democratic overall, while Downtown runs about 39 points more Republican.
Developed land and Republican lean
Places with a rural land-use pattern tend to lean Republican; Downtown, Prosser, WA sits in the bottom quarter nationally on this measure. Developed land does not change how people vote; it mostly reflects how urban a place is.
Why turnout in Downtown looks the way it does
Turnout in Downtown sits close to the national pattern. Routine healthcare access, homeownership, education, and food security all land near their national averages here. Learn more about the findings and methodology on the political spectrum map.
Nearby Neighborhoods
- Keene Valley, Richland, WA R+9
- Stevens Triangle, Richland, WA R+4
- Gold Coast, Richland, WA D+10
- Meadow Springs, Richland, WA R+7
- North Richland, Richland, WA D+9
- Lovisa Farms, Pasco, WA R+23
- Creekstone, Kennewick, WA R+28
- Sun Willows, Pasco, WA D+13
- Sylvester Park, Pasco, WA D+17
- Gresham-Northeast, Gresham, OR D+10
Neighborhoods with Similar Populations
- Central Brambleton, Norfolk, VA D+84
- Bel Aire, Wheat Ridge, CO D+23
- McClure Park, Tulsa, OK D+3
- Claremont Cottages, Chicago, IL D+71
- Shockoe Bottom, Richmond, VA D+65
- Belview Heights, Birmingham, AL D+90
- Terrell Wells, San Antonio, TX D+22
- Crossroads-Riverbank, Riverbank, CA R+19
- Craig Farms, Port Orange, FL R+31
- Greens of McKinney, McKinney, TX R+2
Sources and methodology
Precinct-level voting records used to fit the model come from Washington Secretary of State, Elections, distributed by the Voting and Election Science Team. Demographic inputs come from the U.S. Census Bureau (ACS 5-year estimates and the 2020 Decennial Census). Health and environmental inputs come from the CDC (PLACES and the Environmental Justice Index). Land cover comes from the USGS and EPA. Election-day and lead-up weather come from PRISM 4km daily grids and the NOAA Global Historical Climatology Network. Mail-voting and election-administration patterns come from the MIT Election Lab's Survey of the Performance of American Elections. Block-group crime detail comes from CrimeGrade. Internet data and modeling support provided by ISPreports.org.
Modeling and analysis by the BestNeighborhood data science team. Full methodology and findings: political spectrum map.
Methodology reviewed by the BestNeighborhood data team. Last updated May 2026.