Creekstone leans Republican by roughly 28 points: about 36% of voters vote Democratic and 64% Republican.
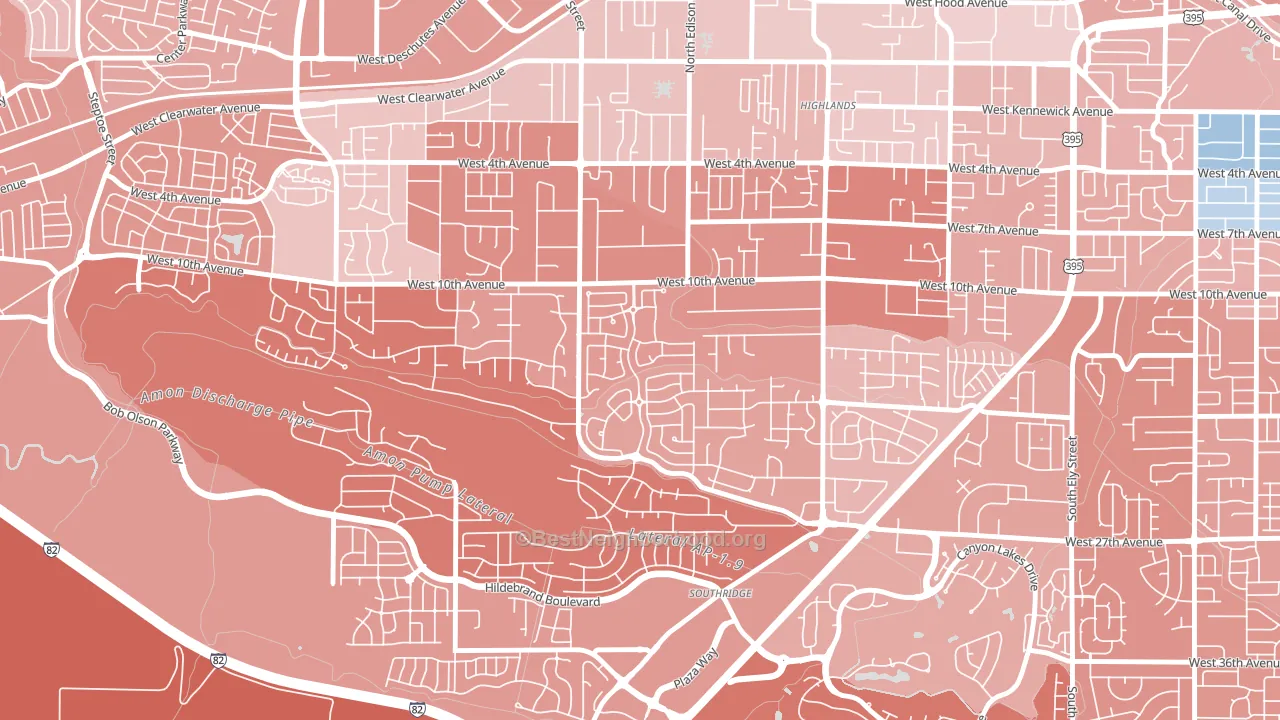
About more than 99% of adults in Creekstone typically vote, above the U.S. average of about 62%. Among adults in Creekstone, ~37% vote Democratic, ~65% Republican, and ~-2% don't vote. The map below shows estimated turnout by block group.
How Creekstone compares
Creekstone runs about 47 points more Republican than Washington as a whole. Washington leans Democratic overall, while Creekstone is one of the few Republican-leaning pockets.
Why Creekstone leans the way it does
This analysis examined 14,881 data points per neighborhood to find what predicts political lean and turnout. The items below are a few correlations that stood out for Creekstone, not a ranked or complete list of what matters most.
Creekstone votes against the grain of Washington. Washington leans Democratic overall, while Creekstone runs about 47 points more Republican.
Park access and Republican lean
Places with low park coverage tend to lean Republican; Creekstone, Kennewick, WA sits in the bottom quarter nationally on this measure. Park access does not change how people vote; it tends to track denser, higher-income areas.
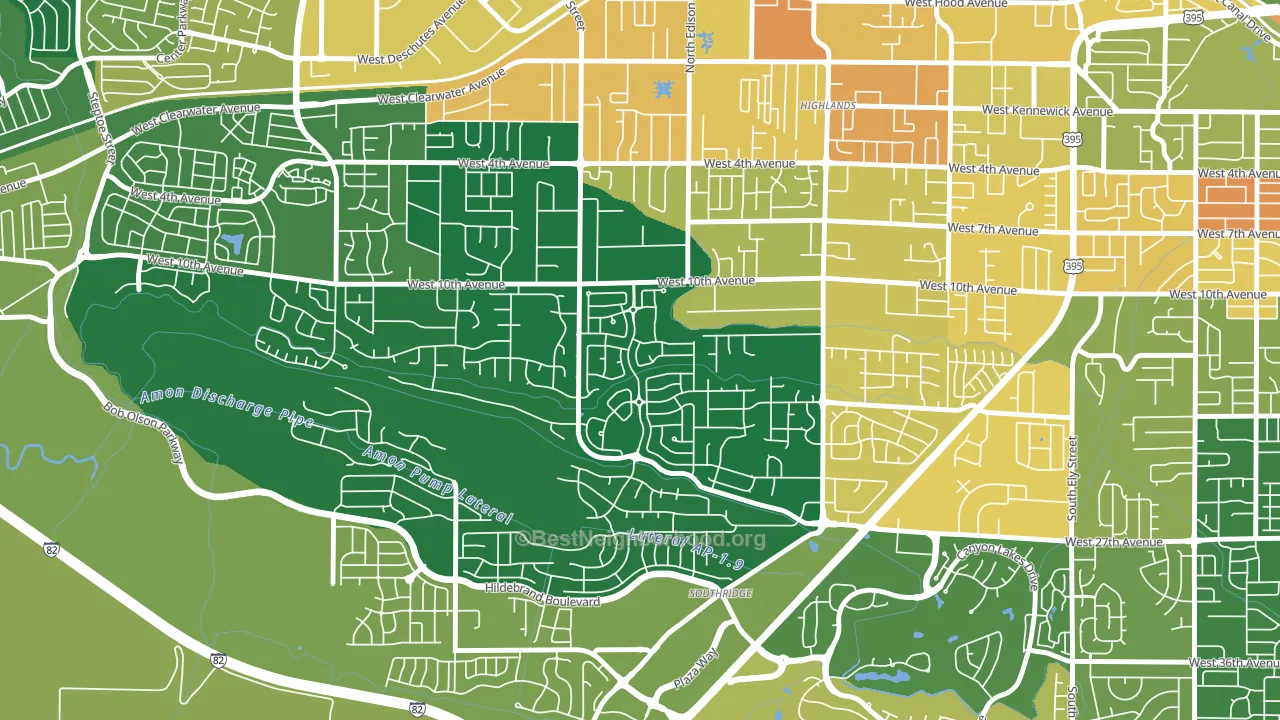
Why turnout in Creekstone looks the way it does
Homeowners vote more often than renters. About 97% of households in Creekstone own their home, about 24 points above the Washington average of 73%. High high-school completion lines up with higher turnout, and about 98% of adults in Creekstone have completed high school, above 87% of neighborhoods. Learn more about the findings and methodology on the political spectrum map.
Nearby Neighborhoods
- Meadow Springs, Richland, WA R+7
- Keene Valley, Richland, WA R+9
- Lovisa Farms, Pasco, WA R+23
- Sylvester Park, Pasco, WA D+17
- Sun Willows, Pasco, WA D+13
- Gold Coast, Richland, WA D+10
- Stevens Triangle, Richland, WA R+4
- North Richland, Richland, WA D+9
- Downtown, Prosser, WA R+20
- Thorpe Westwood, Spokane, WA R+9
Neighborhoods with Similar Populations
- East Village, San Antonio, TX D+22
- Soulard, St. Louis, MO D+64
- Frye Circle, Andover, MA D+42
- Troutman Park, Fort Collins, CO D+32
- Downtown Nashua, Nashua, NH D+31
- Limberlost, Tucson, AZ D+33
- Wellshire, Denver, CO D+49
- Newton Square, Worcester, MA D+31
- Stablewood-Valley Hi North-Houston, Cypress, TX R+24
- Leisureville, Boynton Beach, FL Even
Sources and methodology
Precinct-level voting records used to fit the model come from Washington Secretary of State, Elections, distributed by the Voting and Election Science Team. Demographic inputs come from the U.S. Census Bureau (ACS 5-year estimates and the 2020 Decennial Census). Health and environmental inputs come from the CDC (PLACES and the Environmental Justice Index). Land cover comes from the USGS and EPA. Election-day and lead-up weather come from PRISM 4km daily grids and the NOAA Global Historical Climatology Network. Mail-voting and election-administration patterns come from the MIT Election Lab's Survey of the Performance of American Elections. Block-group crime detail comes from CrimeGrade. Internet data and modeling support provided by ISPreports.org.
Modeling and analysis by the BestNeighborhood data science team. Full methodology and findings: political spectrum map.
Methodology reviewed by the BestNeighborhood data team. Last updated May 2026.