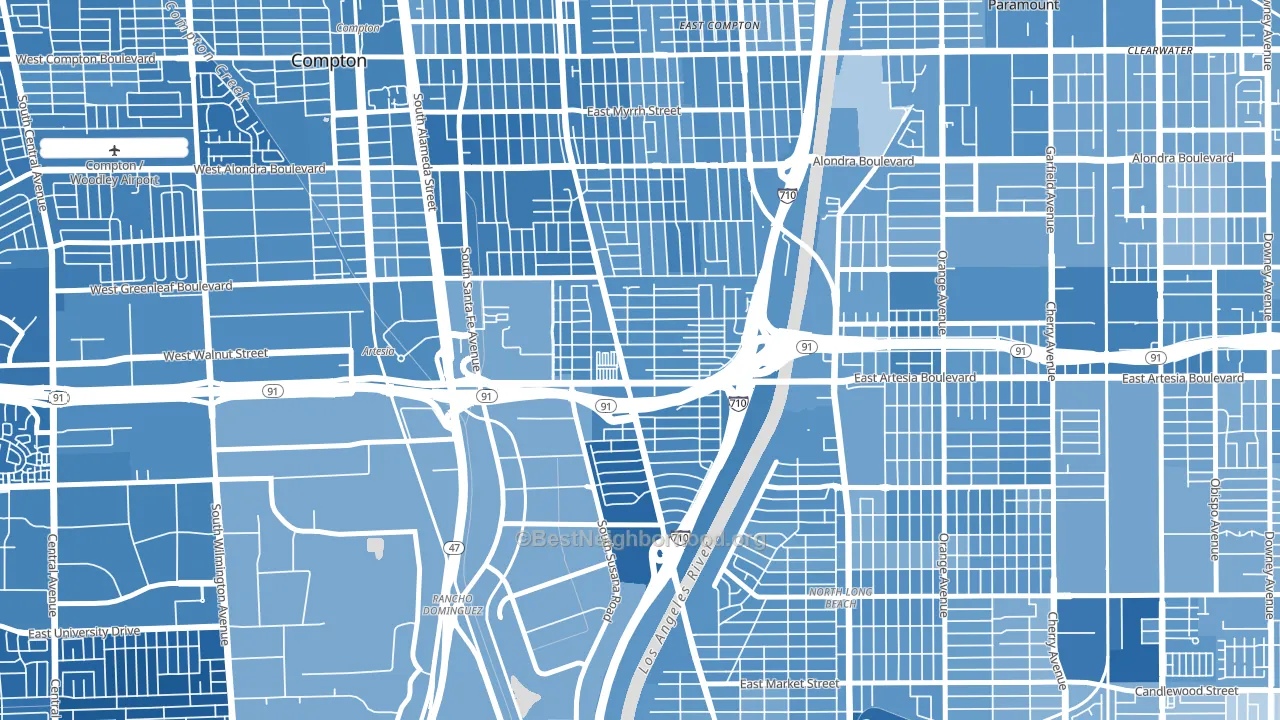
North West Long Beach leans heavily Democratic by roughly 50 points: about 75% of voters vote Democratic and 25% Republican.
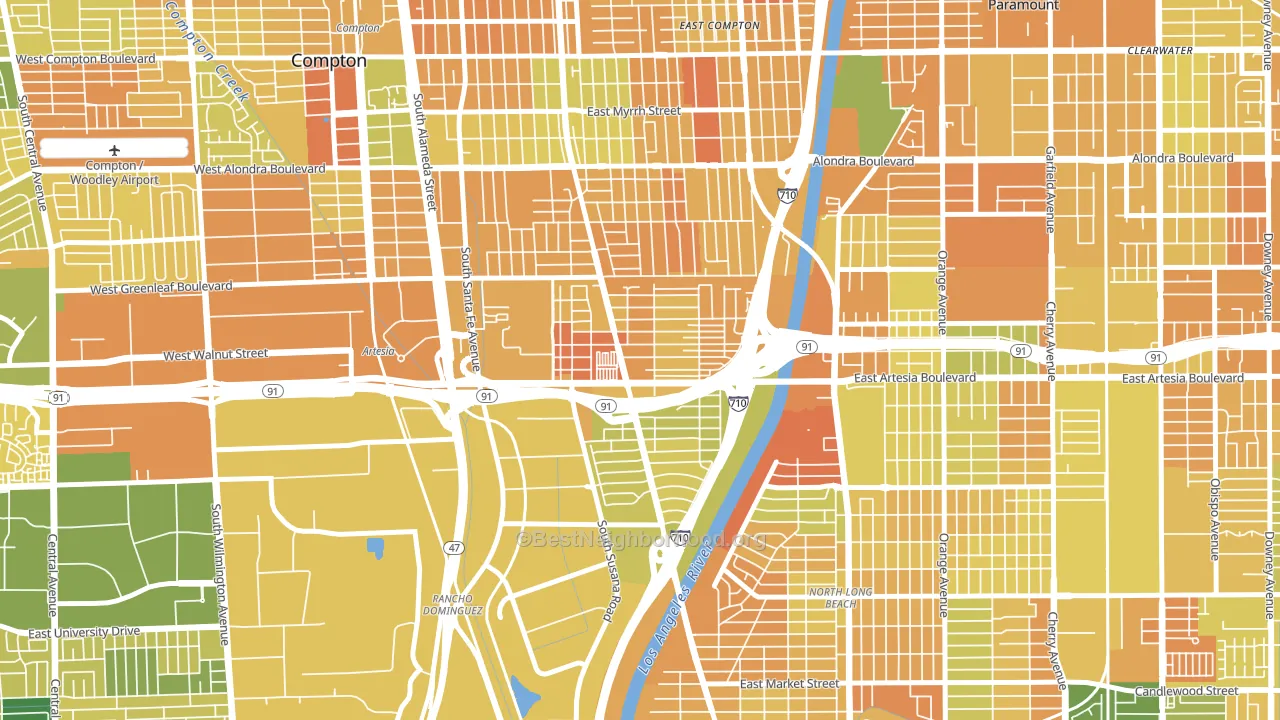
About 39% of adults in North West Long Beach typically vote, below the U.S. average of about 62%. Among adults in North West Long Beach, ~29% vote Democratic, ~10% Republican, and ~61% don't vote. The map below shows estimated turnout by block group.
How North West Long Beach compares
Among neighborhoods within 5 miles, North West Long Beach leans more Democratic than 9 of 11 neighbors.
North West Long Beach runs about 29 points more Democratic than California as a whole.
Politics vary noticeably by block within North West Long Beach. The southwest side is the most Democratic-leaning (D+72) and the west side is the least Democratic-leaning (D+41), a spread of about 31 points.
Why North West Long Beach leans the way it does
This analysis examined 14,881 data points per neighborhood to find what predicts political lean and turnout. The items below are a few correlations that stood out for North West Long Beach, not a ranked or complete list of what matters most.
Dense areas vote Democratic. More than 99% of residents in North West Long Beach live in densely developed areas, about 64 points above the U.S. average of 36%. A high never-married share predicts Democratic voting, and about 47% of adults in North West Long Beach have never been married, above 76% of neighborhoods.
Cancer-screening access and voter turnout
Places with low colon-cancer-screening access tend to turn out at a lower rate; North West Long Beach, Long Beach, CA sits in the bottom tenth nationally on this measure. Cancer screening does not drive turnout; it reflects income, insurance, and healthcare access.
Why turnout in North West Long Beach looks the way it does
Areas with limited routine healthcare access turn out at lower rates. North West Long Beach is in the bottom quarter nationally for routine-care measures such as insurance coverage, preventive screenings, and dental visits. High food insecurity lines up with lower turnout, and about 31% of adults in North West Long Beach report food insecurity, above 84% of neighborhoods. Low high-school completion lines up with lower turnout, and about 75% of adults in North West Long Beach have completed high school, below 91% of neighborhoods. Learn more about the findings and methodology on the political spectrum map.
Nearby Neighborhoods
- Rancho Dominguez, Compton, CA D+39
- North Long Beach, Long Beach, CA D+39
- Bixby Area, Long Beach, CA D+37
- Bixby Knolls, Long Beach, CA D+46
- Los Cerritos, Long Beach, CA D+40
- Hollydale, South Gate, CA D+31
- West Rancho Domingues, Compton, CA D+61
- Californial Heights, Long Beach, CA D+46
- Lakewood Village, Long Beach, CA D+24
- West Side, Long Beach, CA D+34
Neighborhoods with Similar Populations
- Near East, Columbus, OH D+76
- Desert Shores, Las Vegas, NV D+22
- Talbot's Corner, Nashville, TN D+59
- Old Everett, Lansing, MI D+33
- Brewerytown, Philadelphia, PA D+85
- Tower Grove South, St. Louis, MO D+65
- Pine Hills, Albany, NY D+62
- Maple Leaf, Seattle, WA D+78
- Wedgwood, Seattle, WA D+76
- Congress Heights, Washington, DC D+86
Sources and methodology
Precinct-level voting records used to fit the model come from California Secretary of State, Elections, distributed by the Voting and Election Science Team. Demographic inputs come from the U.S. Census Bureau (ACS 5-year estimates and the 2020 Decennial Census). Health and environmental inputs come from the CDC (PLACES and the Environmental Justice Index). Land cover comes from the USGS and EPA. Election-day and lead-up weather come from PRISM 4km daily grids and the NOAA Global Historical Climatology Network. Mail-voting and election-administration patterns come from the MIT Election Lab's Survey of the Performance of American Elections. Block-group crime detail comes from CrimeGrade. Internet data and modeling support provided by ISPreports.org.
Modeling and analysis by the BestNeighborhood data science team. Full methodology and findings: political spectrum map.
Methodology reviewed by the BestNeighborhood data team. Last updated May 2026.