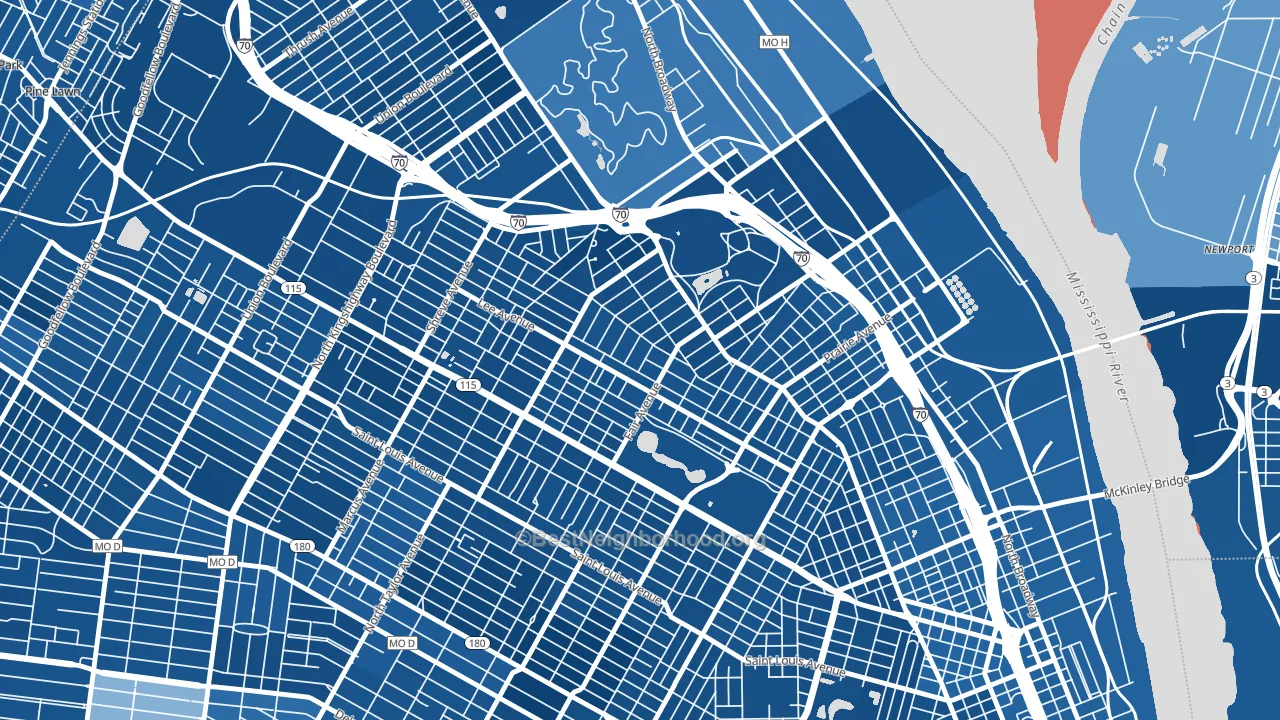
O'Fallon is a Democratic stronghold. About 94% of voters here vote Democratic and 6% Republican.
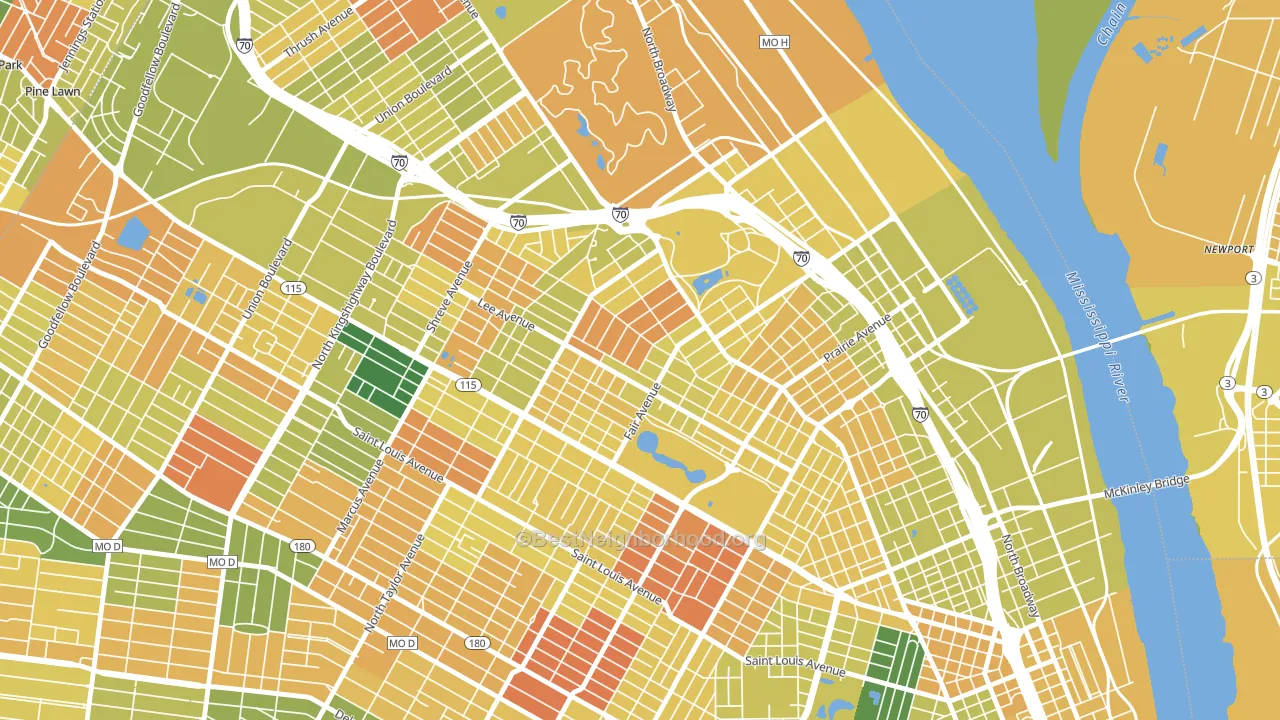
About 43% of adults in O'Fallon typically vote, below the U.S. average of about 62%. Among adults in O'Fallon, ~41% vote Democratic, ~3% Republican, and ~56% don't vote. The map below shows estimated turnout by block group.
How O'Fallon compares
Among neighborhoods within 5 miles, O'Fallon leans more Democratic than 19 of 20 neighbors.
O'Fallon runs about 105 points more Democratic than Missouri as a whole. Missouri leans Republican overall, while O'Fallon is one of the few Democratic-leaning pockets.
Why O'Fallon leans the way it does
This analysis examined 14,881 data points per neighborhood to find what predicts political lean and turnout. The items below are a few correlations that stood out for O'Fallon, not a ranked or complete list of what matters most.
Dense areas vote Democratic. More than 99% of residents in O'Fallon live in densely developed areas, about 64 points above the U.S. average of 36%. O'Fallon runs against the grain of Missouri, a Democratic-leaning pocket in a Republican-leaning state.
Paved land cover and Democratic lean
Places with extensive paved surfaces tend to lean Democratic; O'Fallon, St. Louis, MO sits in the top quarter nationally on this measure. Paved ground does not change how people vote; it mostly reflects how urban and built-up a place is.
Why turnout in O'Fallon looks the way it does
Areas with high food insecurity turn out at lower rates. About 40% of adults in O'Fallon report food insecurity, about 23 points above the U.S. average of 16%. Renters vote less often than owners, and about 63% of households in O'Fallon rent, about 38 points above the U.S. average of 25%. High-crime urban areas turn out at lower rates, and O'Fallon sits in the top 15% on a violent-crime measure. Learn more about the findings and methodology on the political spectrum map.
Nearby Neighborhoods
- Penrose, St. Louis, MO D+86
- The Greater Ville, St. Louis, MO D+87
- Jeff-Vander-Lou, St. Louis, MO D+84
- Mark Twain, St. Louis, MO D+85
- Grand Center, St. Louis, MO D+74
- Wells-Goodfellow, St. Louis, MO D+86
- Central West End, St. Louis, MO D+69
- Midtown St. Louis, St. Louis, MO D+71
- North Pointe, St. Louis, MO D+89
- Baden, St. Louis, MO D+83
Neighborhoods with Similar Populations
- Helderberg, Albany, NY D+57
- University Drive, Coral Springs, FL D+15
- Campus Commons, Sacramento, CA D+48
- West Sharyland, Mission, TX R+3
- Centerville Historic District, Centerville, OH R+3
- Independence Plaza, Kansas City, MO D+61
- San Jose Forest, Jacksonville, FL R+23
- Pine Brook, Camp Hill, PA Even
- Arrowhead Park, Brick, NJ R+33
- Woodlands at Fiore, Buffalo Grove, IL D+26
Sources and methodology
Precinct-level voting records used to fit the model come from Missouri Secretary of State, Elections, distributed by the Voting and Election Science Team. Demographic inputs come from the U.S. Census Bureau (ACS 5-year estimates and the 2020 Decennial Census). Health and environmental inputs come from the CDC (PLACES and the Environmental Justice Index). Land cover comes from the USGS and EPA. Election-day and lead-up weather come from PRISM 4km daily grids and the NOAA Global Historical Climatology Network. Mail-voting and election-administration patterns come from the MIT Election Lab's Survey of the Performance of American Elections. Block-group crime detail comes from CrimeGrade. Internet data and modeling support provided by ISPreports.org.
Modeling and analysis by the BestNeighborhood data science team. Full methodology and findings: political spectrum map.
Methodology reviewed by the BestNeighborhood data team. Last updated May 2026.