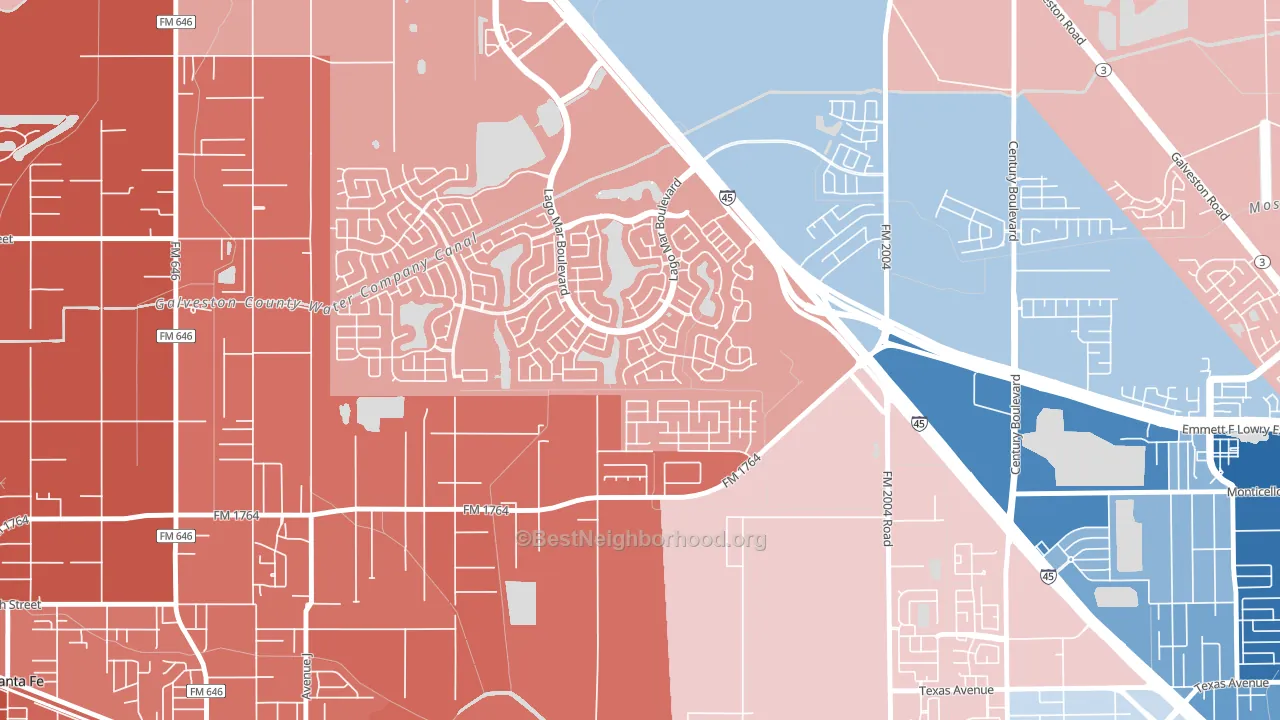
Painted Meadows leans Republican by roughly 30 points: about 35% of voters vote Democratic and 65% Republican.
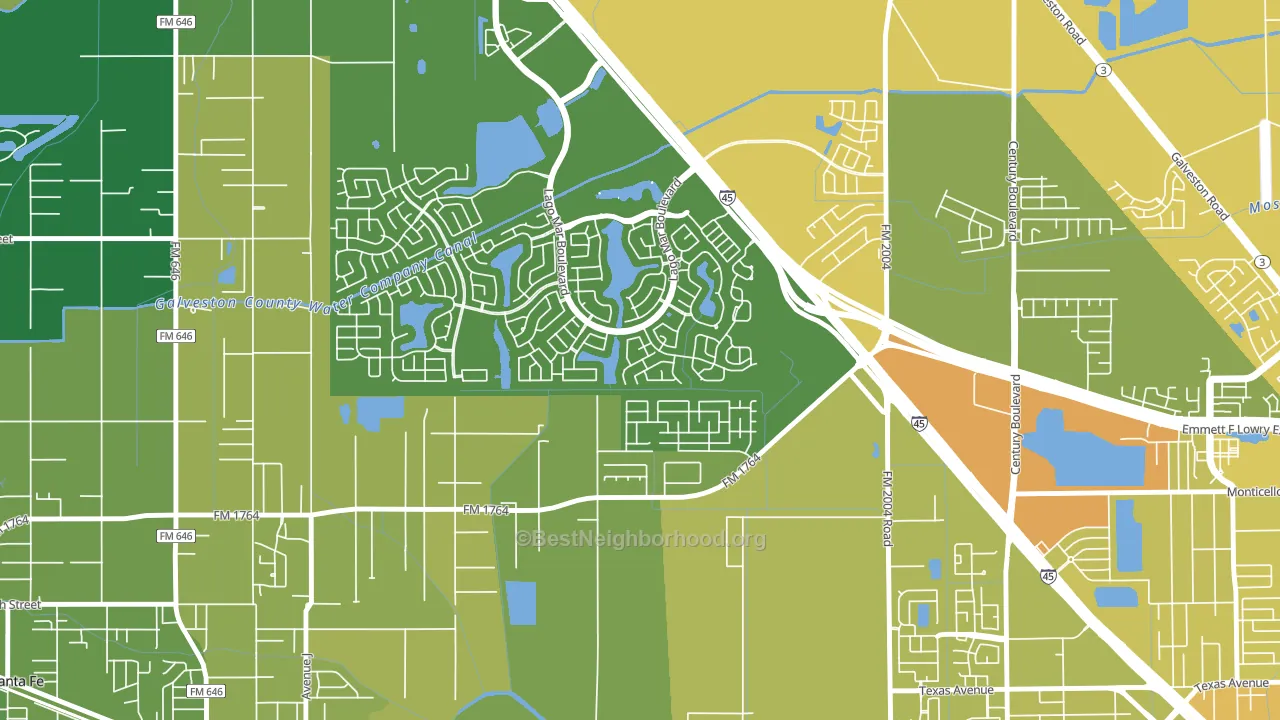
About 87% of adults in Painted Meadows typically vote, above the U.S. average of about 62%. Among adults in Painted Meadows, ~30% vote Democratic, ~57% Republican, and ~13% don't vote. The map below shows estimated turnout by block group.
How Painted Meadows compares
Painted Meadows runs about 16 points more Republican than Texas as a whole.
Politics vary noticeably by block within Painted Meadows. The south side is the most Republican-leaning (R+44) and the east side is the least Republican-leaning (R+29), a spread of about 15 points.
Why Painted Meadows leans the way it does
This analysis examined 14,881 data points per neighborhood to find what predicts political lean and turnout. The items below are a few correlations that stood out for Painted Meadows, not a ranked or complete list of what matters most.
Rural areas vote Republican, and Painted Meadows sits in the bottom quarter on developed land relative to similar places.
Population density and Republican lean
Places with low population density tend to lean Republican; Painted Meadows, Santa Fe, TX sits in the bottom quarter nationally on this measure.
Why turnout in Painted Meadows looks the way it does
Turnout in Painted Meadows sits close to the national pattern. Routine healthcare access, homeownership, education, and food security all land near their national averages here. Learn more about the findings and methodology on the political spectrum map.
Nearby Neighborhoods
- Bay Colony, League City, TX R+14
- Tuscan Lakes, League City, TX R+19
- Mainland Park, Texas City, TX R+20
- South Shore Harbour and Marina, League City, TX R+20
- Clear Lake, Houston, TX R+8
- Bayou Shore, Galveston, TX D+19
- Southbelt Ellington, Houston, TX D+3
- Pasadina, Houston, TX D+4
- South Houston Gardens, Pasadena, TX R+20
- Downtown La Porte, La Porte, TX R+25
Neighborhoods with Similar Populations
- Woodmere, Jacksonville, FL R+6
- Laddie Place and North Wilson, San Antonio, TX D+30
- Cypress Run, Coral Springs, FL D+10
- Sunnyheights, Pueblo, CO D+5
- Edison, San Antonio, TX D+35
- Navco, Mobile, AL D+77
- Pioneer, Butte, MT D+5
- Hopecrest, Morgantown, WV D+26
- Downtown Fostoria, Fostoria, OH R+15
- Laurelwood, Albuquerque, NM D+18
Sources and methodology
Precinct-level voting records used to fit the model come from Texas Secretary of State, Elections Division, distributed by the Voting and Election Science Team. Demographic inputs come from the U.S. Census Bureau (ACS 5-year estimates and the 2020 Decennial Census). Health and environmental inputs come from the CDC (PLACES and the Environmental Justice Index). Land cover comes from the USGS and EPA. Election-day and lead-up weather come from PRISM 4km daily grids and the NOAA Global Historical Climatology Network. Mail-voting and election-administration patterns come from the MIT Election Lab's Survey of the Performance of American Elections. Block-group crime detail comes from CrimeGrade. Internet data and modeling support provided by ISPreports.org.
Modeling and analysis by the BestNeighborhood data science team. Full methodology and findings: political spectrum map.
Methodology reviewed by the BestNeighborhood data team. Last updated May 2026.