Parkchester leans heavily Democratic by roughly 34 points: about 67% of voters vote Democratic and 33% Republican.
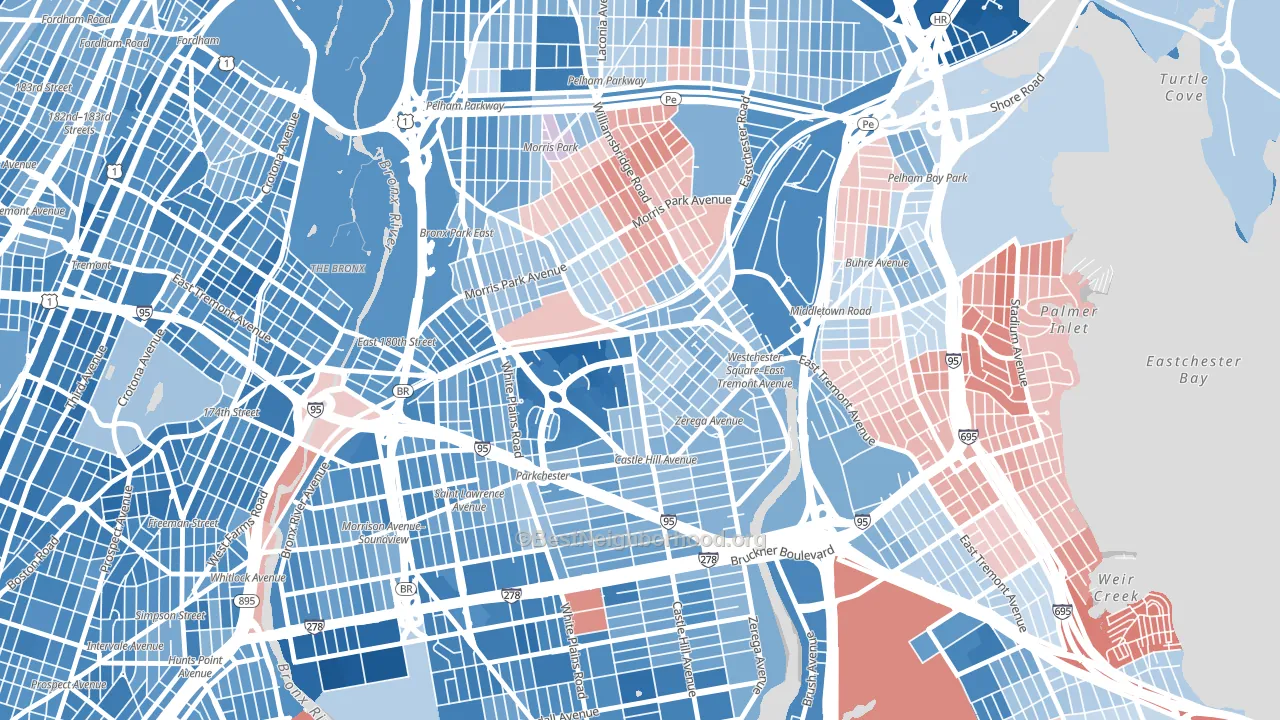
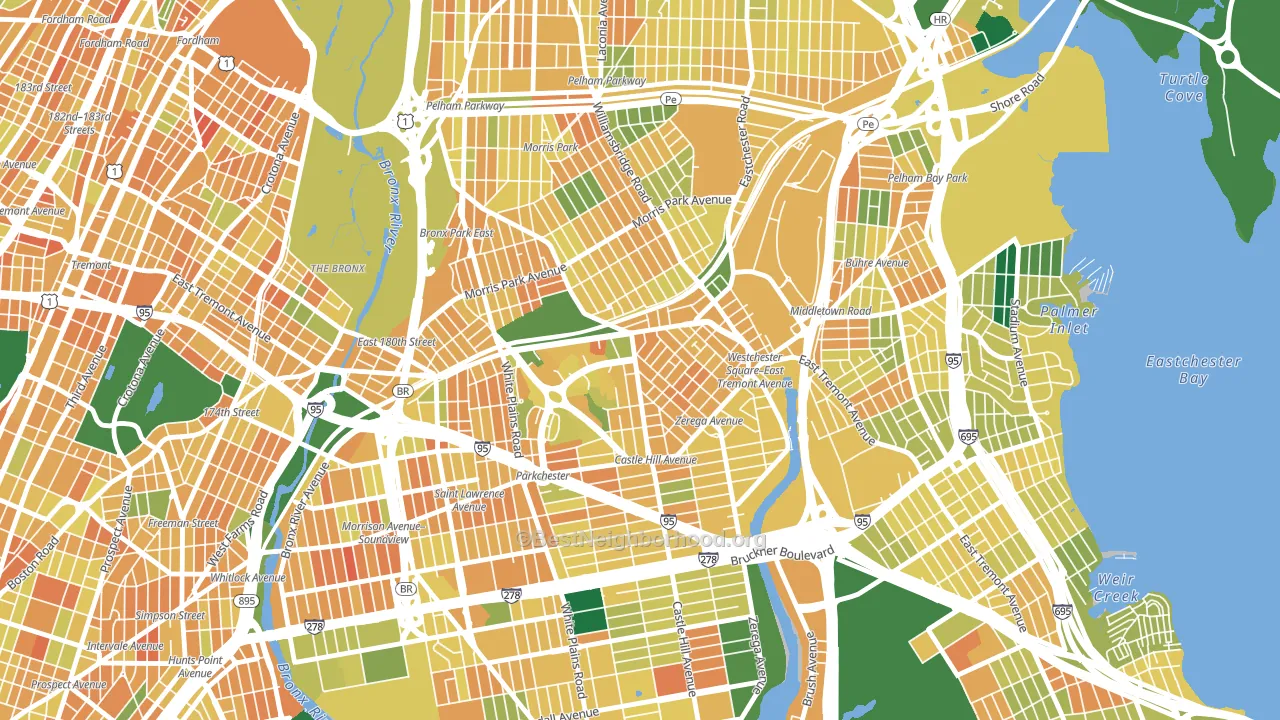
About 43% of adults in Parkchester typically vote, below the U.S. average of about 62%. Among adults in Parkchester, ~29% vote Democratic, ~14% Republican, and ~57% don't vote. The map below shows estimated turnout by block group.
How Parkchester compares
Among neighborhoods within 5 miles, Parkchester leans more Democratic than 14 of 36 neighbors.
Parkchester runs about 22 points more Democratic than New York as a whole.
Politics vary noticeably by block within Parkchester. The west side runs the most Democratic (D+56) and the north side runs the most Republican (Even), a spread of about 57 points.
Why Parkchester leans the way it does
This analysis examined 14,881 data points per neighborhood to find what predicts political lean and turnout. The items below are a few correlations that stood out for Parkchester, not a ranked or complete list of what matters most.
Dense areas vote Democratic. More than 99% of residents in Parkchester live in densely developed areas, about 64 points above the U.S. average of 36%.
High-school completion, developed land, and voter turnout
Places that combine low high-school-completion share and a heavily developed built environment tend to turn out at a lower rate, as Parkchester, Bronx, NY does.
Why turnout in Parkchester looks the way it does
Renters vote less often than owners. About 75% of households in Parkchester rent, about 50 points above the U.S. average of 25%. High food insecurity lines up with lower turnout, and about 32% of adults in Parkchester report food insecurity, above 85% of neighborhoods. Low high-school completion lines up with lower turnout, and about 82% of adults in Parkchester have completed high school, below 82% of neighborhoods. Learn more about the findings and methodology on the political spectrum map.
Nearby Neighborhoods
- Van Nest, Bronx, NY D+19
- Morris Park, Bronx, NY Even
- Middletown-Pelham Bay, Bronx, NY D+12
- Unionport, Bronx, NY D+39
- Bronxdale, Bronx, NY D+31
- West Farms, Bronx, NY D+44
- Schuylerville, Bronx, NY D+11
- Soundview, Bronx, NY D+47
- Baychester, Bronx, NY D+51
- Williamsbridge, Bronx, NY D+47
Neighborhoods with Similar Populations
- Cobbs Creek, Philadelphia, PA D+83
- Evergreen, San Jose, CA D+22
- Bay Ridge-Fort Hamilton, Brooklyn, NY D+9
- Lower East Side, Manhattan, NY D+47
- Elmhurst, Queens, NY D+9
- East Flatbush, Brooklyn, NY D+81
- North, Raleigh, NC D+27
- Northwest, Columbus, OH D+24
- West, Arlington, TX R+6
- North Valley, San Jose, CA D+27
Sources and methodology
Precinct-level voting records used to fit the model come from New York State Board of Elections, distributed by the Voting and Election Science Team. Demographic inputs come from the U.S. Census Bureau (ACS 5-year estimates and the 2020 Decennial Census). Health and environmental inputs come from the CDC (PLACES and the Environmental Justice Index). Land cover comes from the USGS and EPA. Election-day and lead-up weather come from PRISM 4km daily grids and the NOAA Global Historical Climatology Network. Mail-voting and election-administration patterns come from the MIT Election Lab's Survey of the Performance of American Elections. Block-group crime detail comes from CrimeGrade. Internet data and modeling support provided by ISPreports.org.
Modeling and analysis by the BestNeighborhood data science team. Full methodology and findings: political spectrum map.
Methodology reviewed by the BestNeighborhood data team. Last updated May 2026.