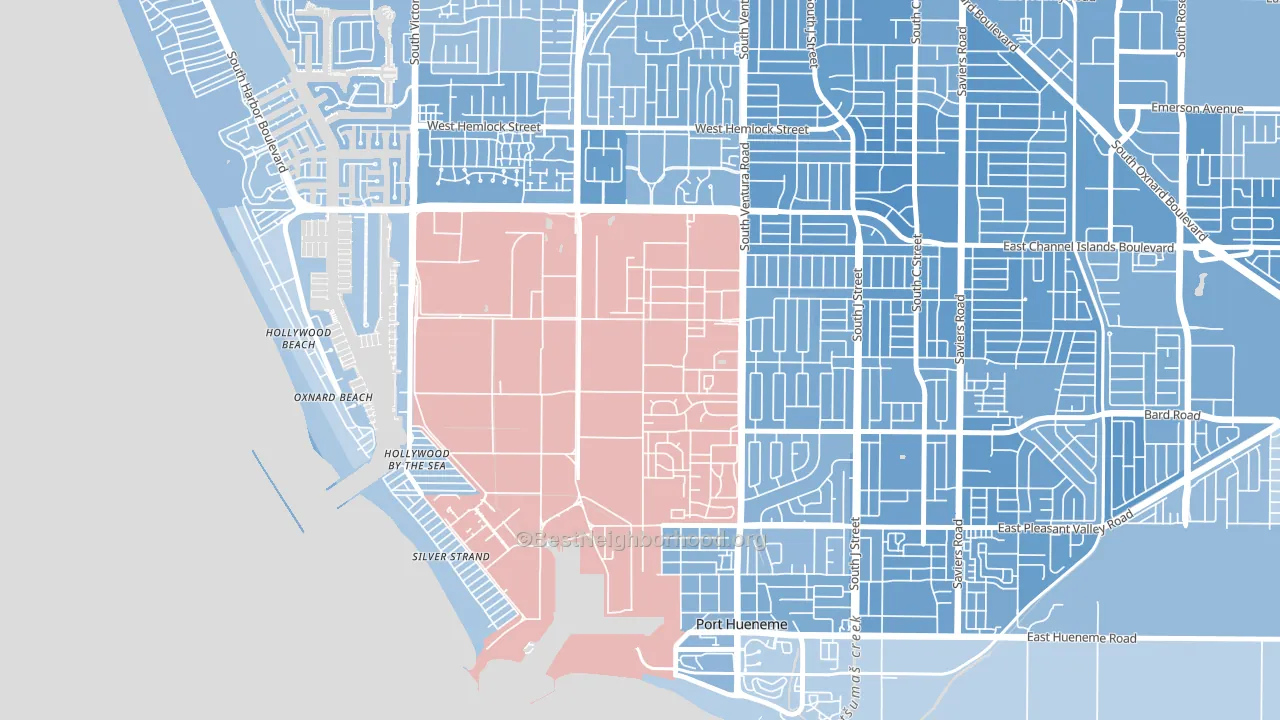
Port Hueneme Cbc Base is a true toss-up. About 48% of voters here vote Democratic and 52% Republican.
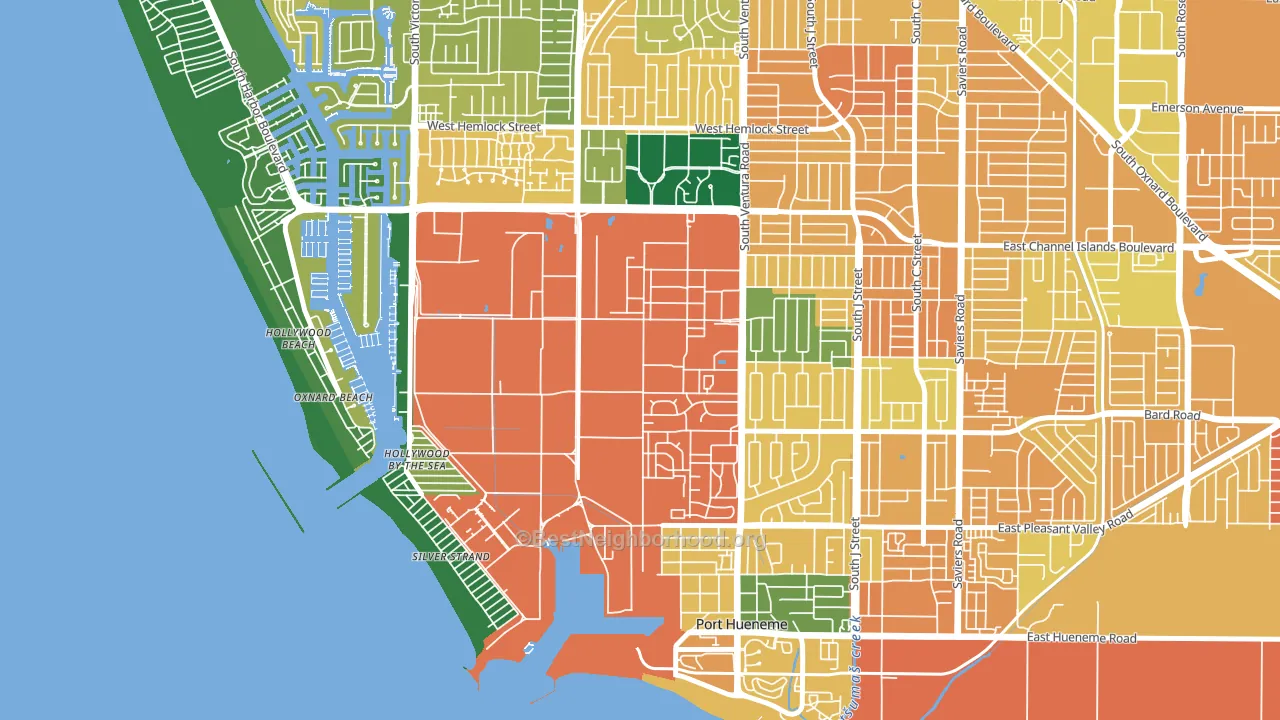
About 20% of adults in Port Hueneme Cbc Base typically vote, below the U.S. average of about 62%. Among adults in Port Hueneme Cbc Base, ~10% vote Democratic, ~10% Republican, and ~80% don't vote. The map below shows estimated turnout by block group.
How Port Hueneme Cbc Base compares
Among cities within 25 miles, Port Hueneme Cbc Base leans more Republican than 20 of 27 neighbors.
Port Hueneme Cbc Base runs about 23 points more Republican than California as a whole. California leans Democratic overall, while Port Hueneme Cbc Base is one of the few Republican-leaning pockets.
Why Port Hueneme Cbc Base leans the way it does
This analysis examined 14,881 data points per city to find what predicts political lean and turnout. The items below are a few correlations that stood out for Port Hueneme Cbc Base, not a ranked or complete list of what matters most.
Port Hueneme Cbc Base votes against the grain of California. California leans Democratic overall, while Port Hueneme Cbc Base runs about 23 points more Republican.
Cancer-screening access and voter turnout
Places with low colon-cancer-screening access tend to turn out at a lower rate; Port Hueneme Cbc Base, CA sits in the bottom tenth nationally on this measure. Cancer screening does not drive turnout; it reflects income, insurance, and healthcare access.
Why turnout in Port Hueneme Cbc Base looks the way it does
Renters vote less often than owners. About 99% of households in Port Hueneme Cbc Base rent, about 74 points above the U.S. average of 25%. Low high-school completion lines up with lower turnout, and about 96% of adults in Port Hueneme Cbc Base have completed high school, above 83% of cities. Learn more about the findings and methodology on the political spectrum map.
Nearby Cities
- Port Hueneme, CA D+22
- Oxnard, CA D+16
- Ventura, CA D+22
- Camarillo, CA D+8
- San Buenaventura, CA D+16
- Somis, CA R+13
- Santa Paula, CA D+21
- Newbury Park, CA D+13
- Moorpark Home Acres, CA R+13
Cities with Similar Populations
- Lavinia, MN R+20
- Lewis Creek, IN R+64
- Thomas Mountain, CA R+17
- Patzau, WI R+29
- East Greenwich, NY R+15
- Rural Hill, NY R+34
- East Franklin, ME R+13
- Headlee, IN R+56
- Hanna, UT R+60
- Vilas, FL R+36
Sources and methodology
Precinct-level voting records used to fit the model come from California Secretary of State, Elections, distributed by the Voting and Election Science Team. Demographic inputs come from the U.S. Census Bureau (ACS 5-year estimates and the 2020 Decennial Census). Health and environmental inputs come from the CDC (PLACES and the Environmental Justice Index). Land cover comes from the USGS and EPA. Election-day and lead-up weather come from PRISM 4km daily grids and the NOAA Global Historical Climatology Network. Mail-voting and election-administration patterns come from the MIT Election Lab's Survey of the Performance of American Elections. Block-group crime detail comes from CrimeGrade. Internet data and modeling support provided by ISPreports.org.
Modeling and analysis by the BestNeighborhood data science team. Full methodology and findings: political spectrum map.
Methodology reviewed by the BestNeighborhood data team. Last updated May 2026.