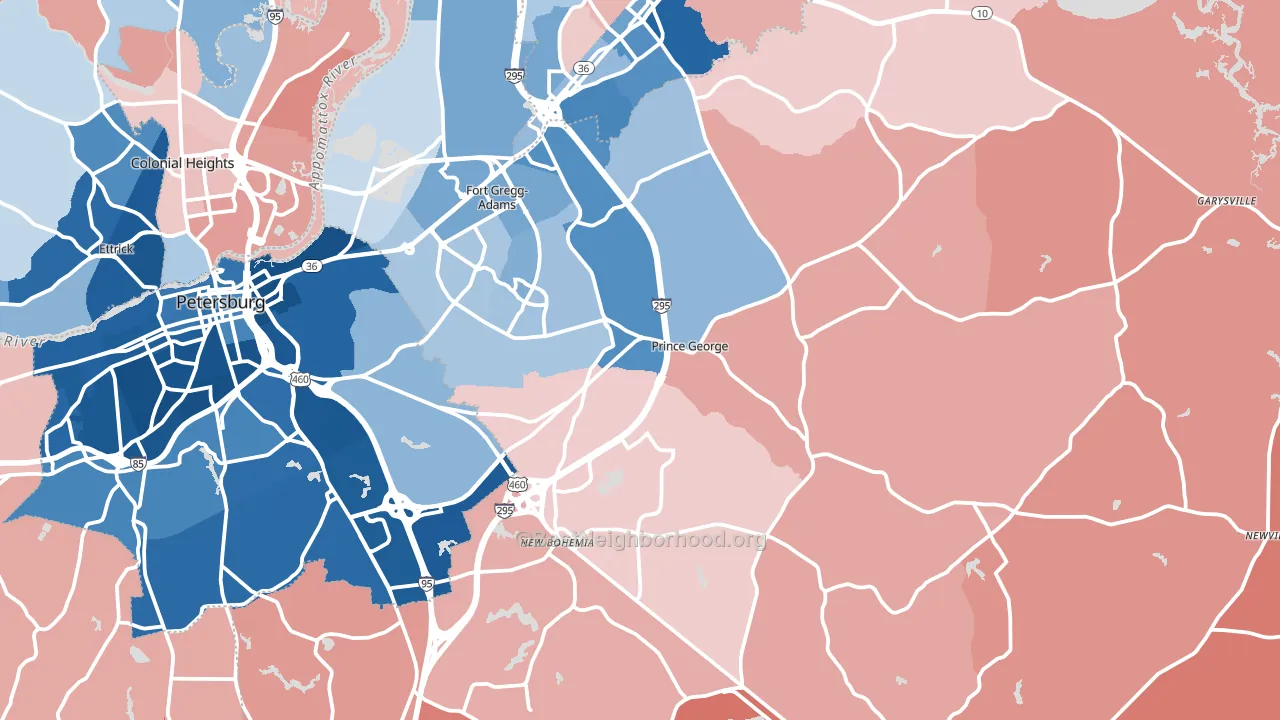
Prince George County is a true toss-up. About 49% of voters here vote Democratic and 51% Republican.
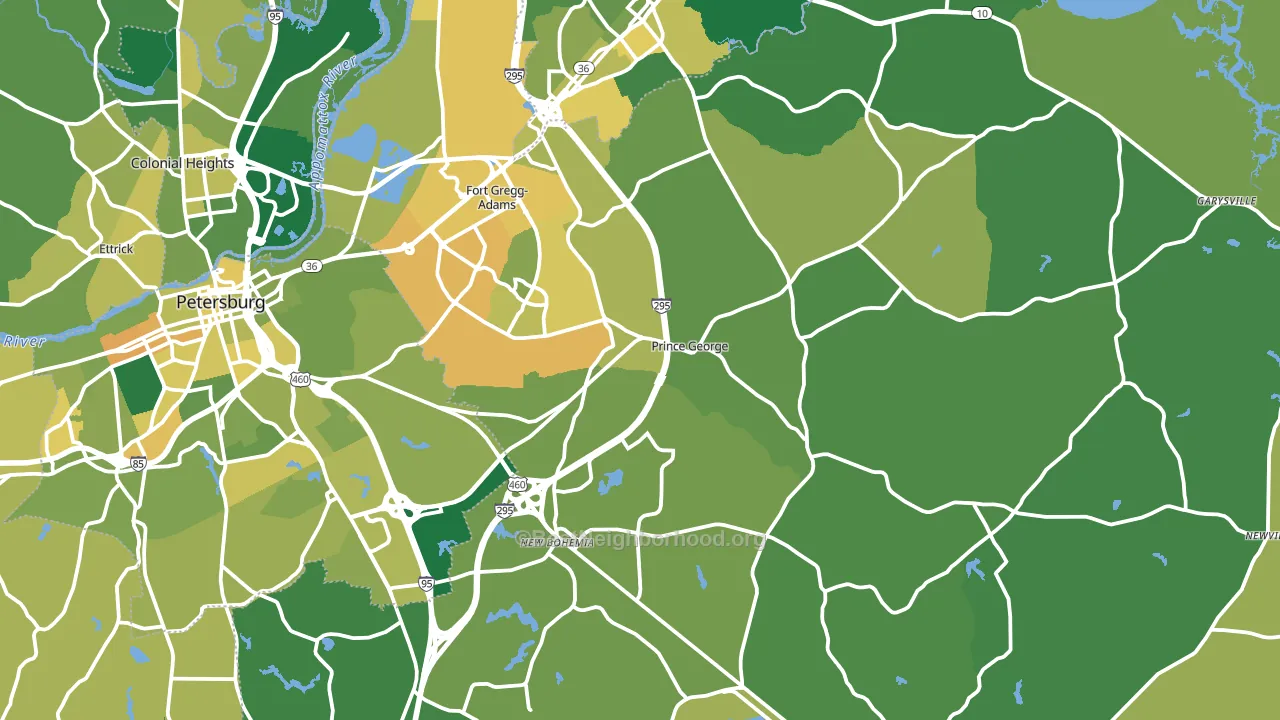
About 73% of adults in Prince George County typically vote, above the U.S. average of about 62%. Among adults in Prince George County, ~36% vote Democratic, ~37% Republican, and ~27% don't vote. The map below shows estimated turnout by block group.
How Prince George County compares
Among counties within 50 miles, Prince George County sits roughly in the middle of the political spectrum, with 15 neighbors leaning further in the place's direction and 14 leaning the other way.
Prince George County runs about 8 points more Republican than Virginia as a whole.
Politics vary noticeably by city within Prince George County. The north side runs the most Democratic (D+20) and the southeast side runs the most Republican (R+38), a spread of about 59 points.
Why Prince George County leans the way it does
Density, race composition, education, and family structure all sit close to their national averages in Prince George County. The lean here lands roughly where demographic data alone would predict.
Adult arthritis and voter turnout
Places with a low adult-arthritis rate tend to turn out at a higher rate; Prince George County, VA sits in the bottom quarter nationally on this measure. Arthritis does not drive turnout; it reflects the age and health profile of an area.
Why turnout in Prince George County looks the way it does
Turnout in Prince George County sits close to the national pattern. Routine healthcare access, homeownership, education, and food security all land near their national averages here. Learn more about the findings and methodology on the political spectrum map.
Nearby Counties
- Hopewell City, VA D+23
- Petersburg City, VA D+71
- Colonial Heights City, VA R+19
- Dinwiddie County, VA R+16
- Charles City County, VA D+8
- Sussex County, VA Even
- Chesterfield County, VA D+12
- Richmond City, VA D+65
- New Kent County, VA R+28
- Surry County, VA D+2
Counties with Similar Populations
- Pettis County, MO R+43
- Sullivan County, NH R+16
- Richmond County, NC R+15
- Douglas County, WA R+25
- Coffee County, GA R+35
- Levy County, FL R+56
- Jackson County, NC R+18
- Cerro Gordo County, IA R+18
- Polk County, GA R+53
- Stephens County, OK R+58
Sources and methodology
Precinct-level voting records used to fit the model come from Virginia Department of Elections, distributed by the Voting and Election Science Team. Demographic inputs come from the U.S. Census Bureau (ACS 5-year estimates and the 2020 Decennial Census). Health and environmental inputs come from the CDC (PLACES and the Environmental Justice Index). Land cover comes from the USGS and EPA. Election-day and lead-up weather come from PRISM 4km daily grids and the NOAA Global Historical Climatology Network. Mail-voting and election-administration patterns come from the MIT Election Lab's Survey of the Performance of American Elections. Block-group crime detail comes from CrimeGrade. Internet data and modeling support provided by ISPreports.org.
Modeling and analysis by the BestNeighborhood data science team. Full methodology and findings: political spectrum map.
Methodology reviewed by the BestNeighborhood data team. Last updated May 2026.