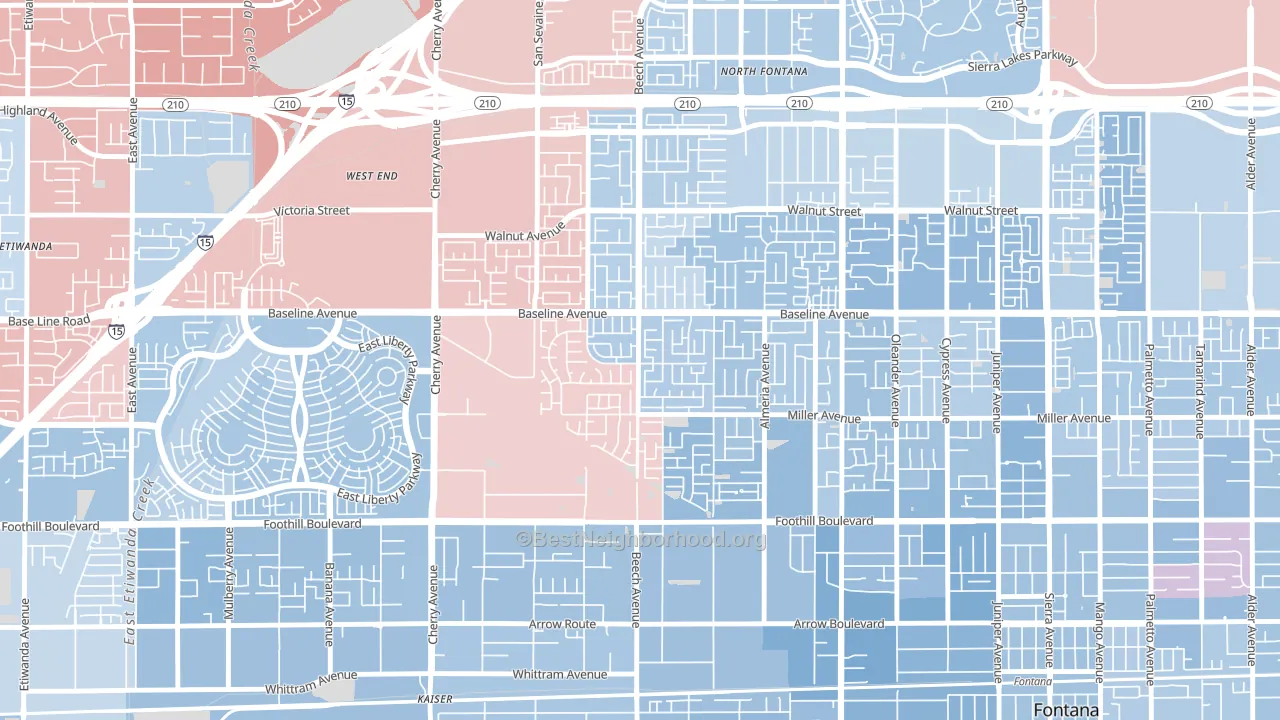
Rancho Fontana leans slightly Democratic by roughly 10 points: about 55% of voters vote Democratic and 45% Republican.
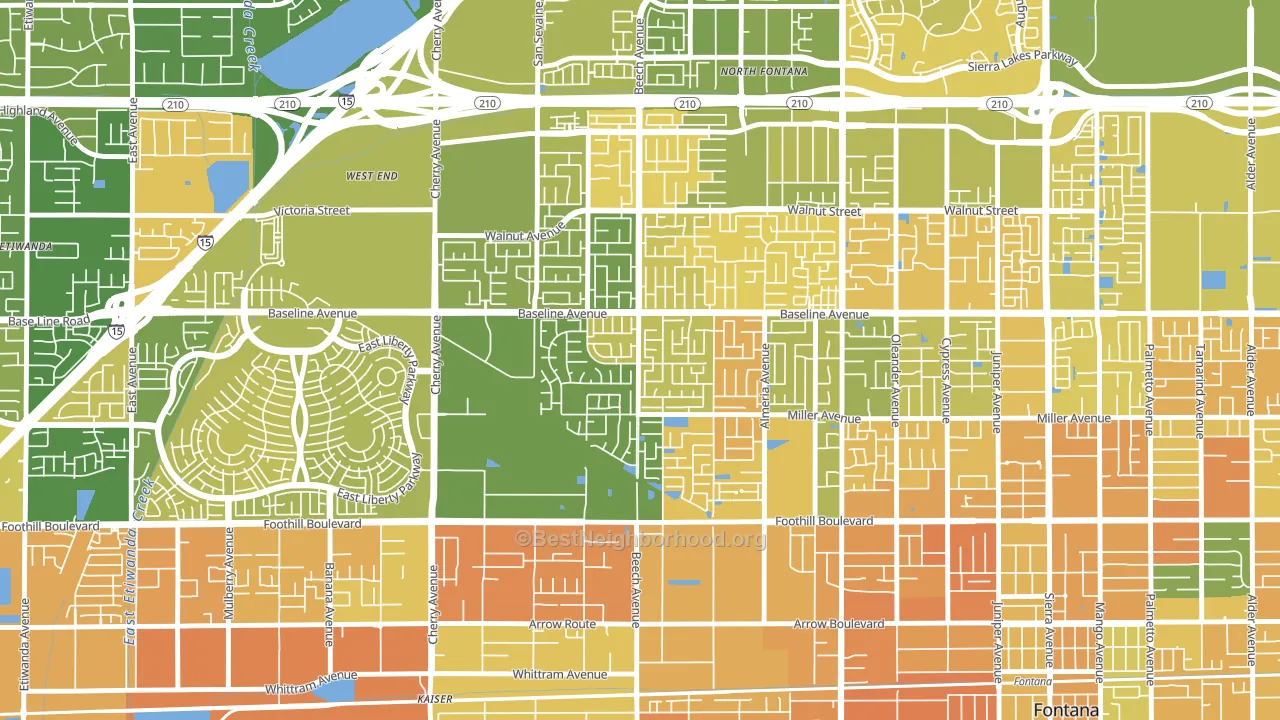
About 61% of adults in Rancho Fontana typically vote, near the U.S. average of about 62%. Among adults in Rancho Fontana, ~34% vote Democratic, ~27% Republican, and ~39% don't vote. The map below shows estimated turnout by block group.
How Rancho Fontana compares
Among neighborhoods within 5 miles, Rancho Fontana leans more Democratic than 2 of 5 neighbors.
Rancho Fontana runs about 11 points more Republican than California as a whole.
Why Rancho Fontana leans the way it does
This analysis examined 14,881 data points per neighborhood to find what predicts political lean and turnout. The items below are a few correlations that stood out for Rancho Fontana, not a ranked or complete list of what matters most.
Density combined with diversity predicts Democratic voting. Non-Hispanic white share in Rancho Fontana is about 21%, about 51 points below the U.S. average of 72%.
Paved land cover and Democratic lean
Places with extensive paved surfaces tend to lean Democratic; Rancho Fontana, Fontana, CA sits in the top quarter nationally on this measure. Paved ground does not change how people vote; it mostly reflects how urban and built-up a place is.
Why turnout in Rancho Fontana looks the way it does
Turnout in Rancho Fontana sits close to the national pattern. Routine healthcare access, homeownership, education, and food security all land near their national averages here. Learn more about the findings and methodology on the political spectrum map.
Nearby Neighborhoods
- West End, Fontana, CA D+13
- Summit Heights, Fontana, CA D+8
- Downtown Fontana, Fontana, CA D+20
- Hunter's Ridge, Fontana, CA R+2
- Victoria Gardens, Rancho Cucamonga, CA D+11
- Southridge Village, Fontana, CA D+17
- Downtown Rialto, Rialto, CA D+28
- Sunnyslope, Riverside, CA Even
- Terrace, San Bernardino, CA D+23
- Rancho West, San Bernardino, CA D+18
Neighborhoods with Similar Populations
- Downtown Menlo Park, Menlo Park, CA D+71
- Downtown Frederick, Frederick, MD D+56
- Providence Estates East, Matthews, NC D+3
- Northwest Berkeley, Berkeley, CA D+82
- Pheasant Hill, Dayton, OH D+3
- Woodville, North Lauderdale, FL D+51
- South Wedge, Rochester, NY D+70
- Lake Terrace and Oaks, New Orleans, LA D+41
- Ghost Town, Laredo, TX D+8
- Blanco Gardens, San Marcos, TX D+24
Sources and methodology
Precinct-level voting records used to fit the model come from California Secretary of State, Elections, distributed by the Voting and Election Science Team. Demographic inputs come from the U.S. Census Bureau (ACS 5-year estimates and the 2020 Decennial Census). Health and environmental inputs come from the CDC (PLACES and the Environmental Justice Index). Land cover comes from the USGS and EPA. Election-day and lead-up weather come from PRISM 4km daily grids and the NOAA Global Historical Climatology Network. Mail-voting and election-administration patterns come from the MIT Election Lab's Survey of the Performance of American Elections. Block-group crime detail comes from CrimeGrade. Internet data and modeling support provided by ISPreports.org.
Modeling and analysis by the BestNeighborhood data science team. Full methodology and findings: political spectrum map.
Methodology reviewed by the BestNeighborhood data team. Last updated May 2026.