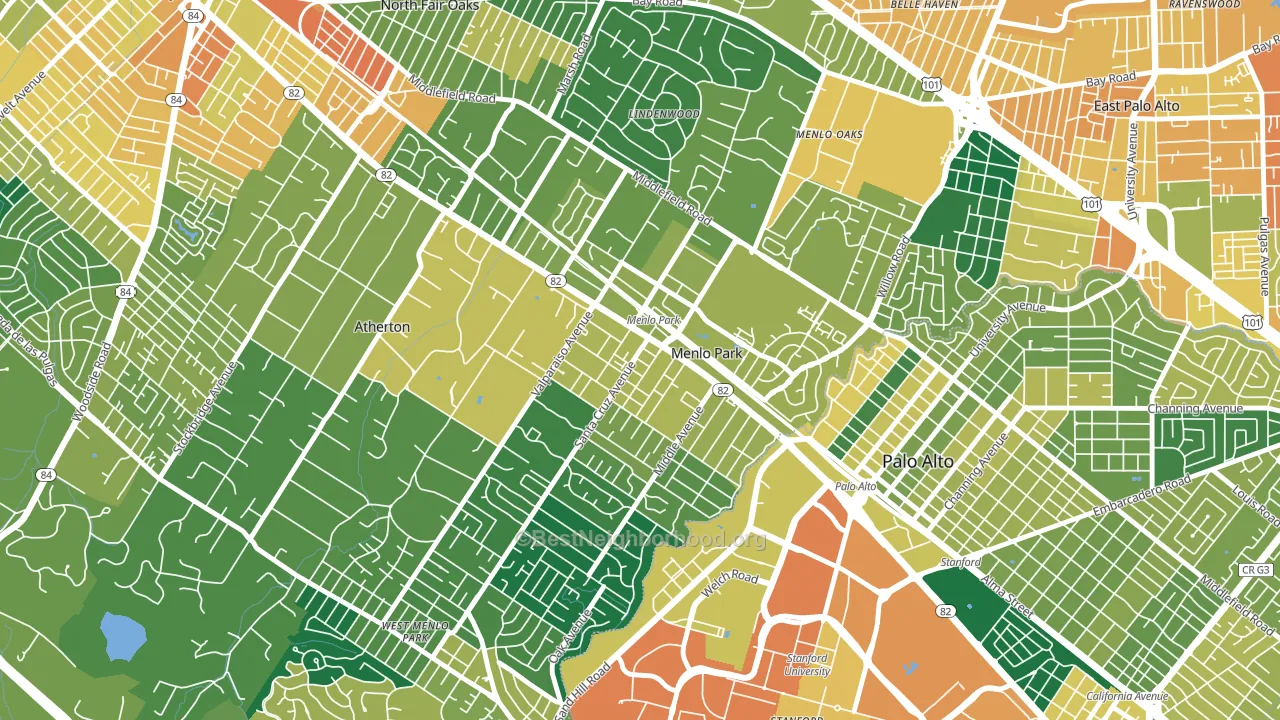
Downtown Menlo Park is a Democratic stronghold. About 85% of voters here vote Democratic and 15% Republican.
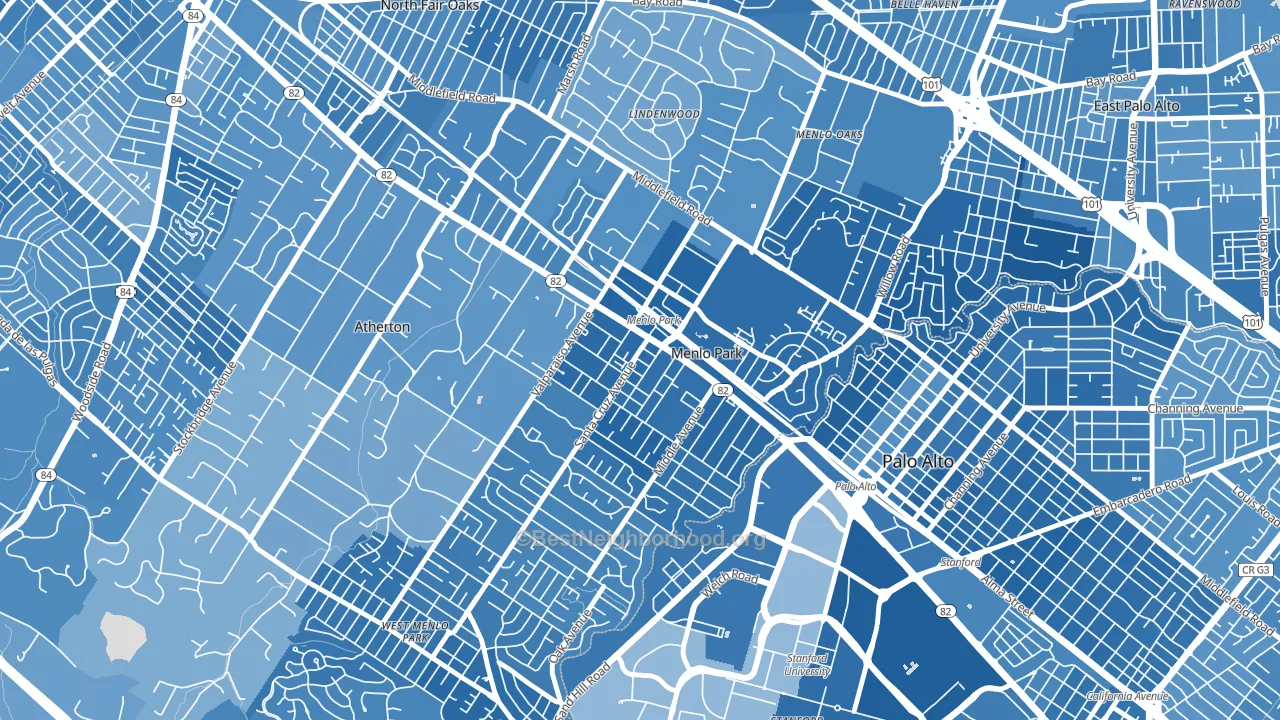
About 67% of adults in Downtown Menlo Park typically vote, near the U.S. average of about 62%. Among adults in Downtown Menlo Park, ~57% vote Democratic, ~10% Republican, and ~33% don't vote. The map below shows estimated turnout by block group.
How Downtown Menlo Park compares
Among neighborhoods within 5 miles, Downtown Menlo Park is the most Democratic-leaning.
Downtown Menlo Park runs about 51 points more Democratic than California as a whole.
Why Downtown Menlo Park leans the way it does
This analysis examined 14,881 data points per neighborhood to find what predicts political lean and turnout. The items below are a few correlations that stood out for Downtown Menlo Park, not a ranked or complete list of what matters most.
Areas with high college attainment vote Democratic. About 77% of adults in Downtown Menlo Park hold a bachelor's degree, about 48 points above the U.S. average of 28%. Dense areas vote Democratic, and Downtown Menlo Park sits in the top fifth on density (more than 99%, above 89% of neighborhoods).
Walkability and Democratic lean
Places with a highly walkable street grid tend to lean Democratic; Downtown Menlo Park, Menlo Park, CA sits in the top quarter nationally on this measure. A walkable street grid does not change how people vote; it mostly reflects how urban a place is.
Why turnout in Downtown Menlo Park looks the way it does
Areas with strong routine healthcare access turn out at higher rates. Downtown Menlo Park is in the top quarter nationally for routine-care measures such as insurance coverage, preventive screenings, and dental visits. The dental-visit rate here is about 76%, about 16 points above the U.S. average of 60%. Learn more about the findings and methodology on the political spectrum map.
Nearby Neighborhoods
- West Atherton, Atherton, CA D+43
- Downtown North San Jose, Palo Alto, CA D+64
- University South, Palo Alto, CA D+66
- Fair Oaks, North Fair Oaks, CA D+54
- Crescent Park, Palo Alto, CA D+68
- Stanford University, Stanford, CA D+64
- Belle Haven, Menlo Park, CA D+50
- Friendly Acres, Redwood City, CA D+47
- Sharon Heights, Menlo Park, CA D+63
- Old Palo Alto, Palo Alto, CA D+69
Neighborhoods with Similar Populations
- Rancho Fontana, Fontana, CA D+9
- Downtown Frederick, Frederick, MD D+56
- Providence Estates East, Matthews, NC D+3
- Northwest Berkeley, Berkeley, CA D+82
- Pheasant Hill, Dayton, OH D+3
- South Wedge, Rochester, NY D+70
- Lake Terrace and Oaks, New Orleans, LA D+41
- Orchidlands Estates, Keaau, HI D+6
- Downtown North Lauderdale, North Lauderdale, FL D+51
- Ghost Town, Laredo, TX D+8
Sources and methodology
Precinct-level voting records used to fit the model come from California Secretary of State, Elections, distributed by the Voting and Election Science Team. Demographic inputs come from the U.S. Census Bureau (ACS 5-year estimates and the 2020 Decennial Census). Health and environmental inputs come from the CDC (PLACES and the Environmental Justice Index). Land cover comes from the USGS and EPA. Election-day and lead-up weather come from PRISM 4km daily grids and the NOAA Global Historical Climatology Network. Mail-voting and election-administration patterns come from the MIT Election Lab's Survey of the Performance of American Elections. Block-group crime detail comes from CrimeGrade. Internet data and modeling support provided by ISPreports.org.
Modeling and analysis by the BestNeighborhood data science team. Full methodology and findings: political spectrum map.
Methodology reviewed by the BestNeighborhood data team. Last updated May 2026.