Sunnyslope is a true toss-up. About 51% of voters here vote Democratic and 49% Republican.
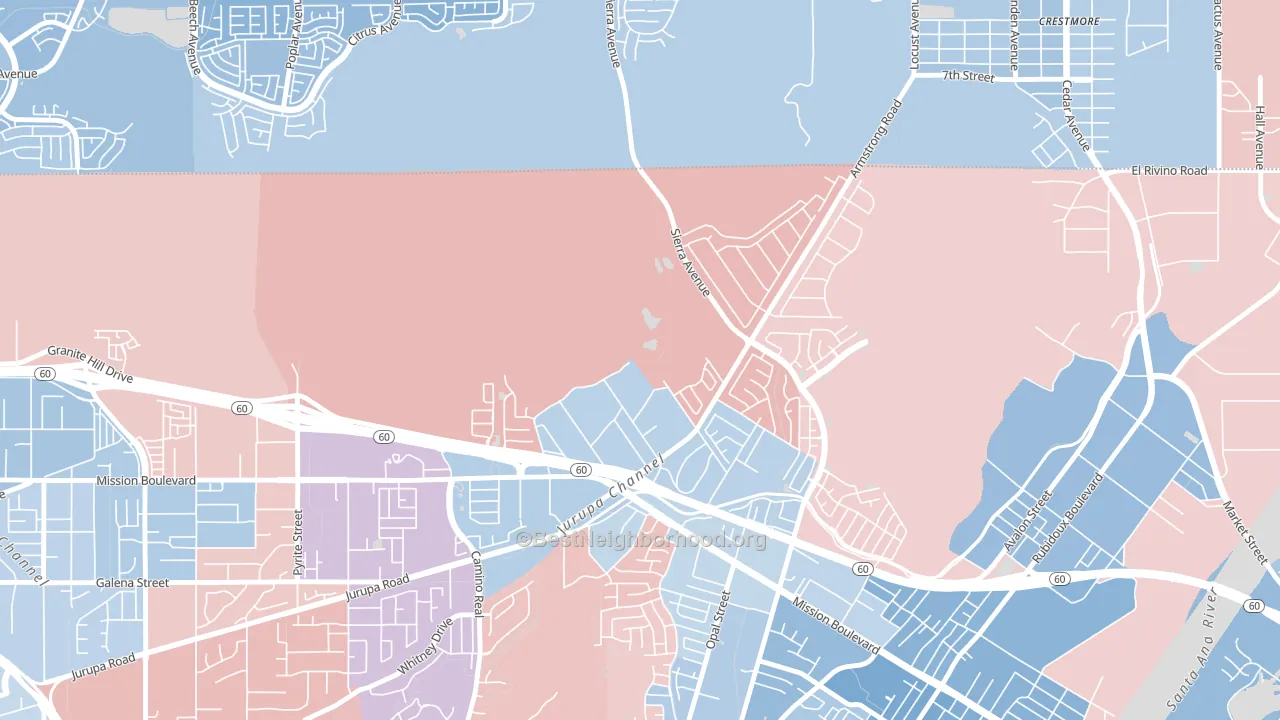
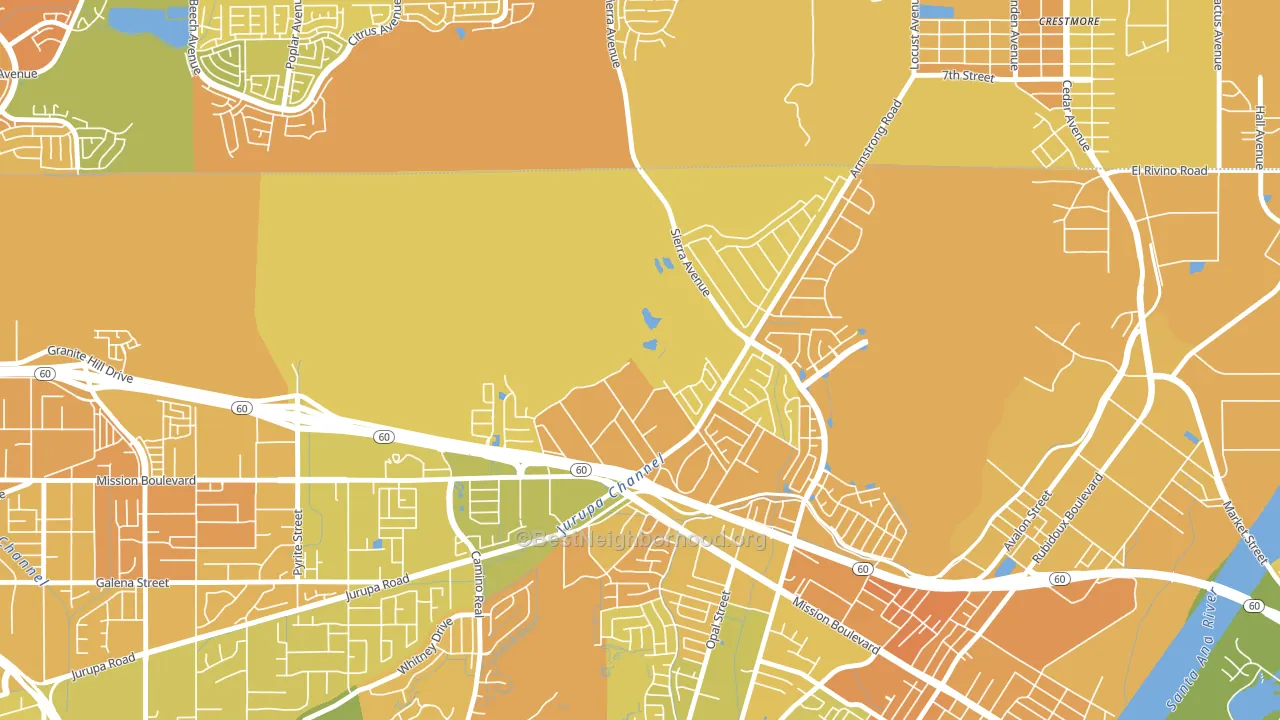
About 38% of adults in Sunnyslope typically vote, below the U.S. average of about 62%. Among adults in Sunnyslope, ~19% vote Democratic, ~19% Republican, and ~62% don't vote. The map below shows estimated turnout by block group.
How Sunnyslope compares
Among neighborhoods within 5 miles, Sunnyslope sits roughly in the middle of the political spectrum, with 0 neighbors leaning further in the place's direction and 6 leaning the other way.
Sunnyslope runs about 18 points more Republican than California as a whole.
Why Sunnyslope leans the way it does
Density, race composition, education, and family structure all sit close to their national averages in Sunnyslope. The lean here lands roughly where demographic data alone would predict.
High-school completion and voter turnout
Places with low high-school-completion share tend to turn out at a lower rate; Sunnyslope, Riverside, CA sits in the bottom quarter nationally on this measure.
Why turnout in Sunnyslope looks the way it does
Crowded housing lines up with lower turnout. About 19% of homes in Sunnyslope have more than one occupant per room, above 98% of neighborhoods. Learn more about the findings and methodology on the political spectrum map.
Nearby Neighborhoods
- Southridge Village, Fontana, CA D+17
- Downtown Riverside, Riverside, CA D+20
- Grand, Riverside, CA D+4
- Northside, Riverside, CA D+17
- Wood Streets, Riverside, CA D+17
- Airport, Riverside, CA D+9
- Magnolia Center, Riverside, CA D+8
- Hunter Industrial Park, Riverside, CA D+19
- Eastside, Riverside, CA D+31
- Downtown Fontana, Fontana, CA D+20
Neighborhoods with Similar Populations
- Shady Lane, Columbus, OH D+66
- Kent Heights, East Providence, RI D+7
- Bay Breeze Cove, St. Petersburg, FL Even
- Gilcrease Hills, Tulsa, OK D+76
- Park Village, San Antonio, TX D+33
- Breen Hills, Kansas City, MO D+7
- Pulaski, Gary, IN D+83
- Oakwood, Knoxville, TN D+32
- Meadows, Boynton Beach, FL D+16
- Menominee South, Oshkosh, WI D+17
Sources and methodology
Precinct-level voting records used to fit the model come from California Secretary of State, Elections, distributed by the Voting and Election Science Team. Demographic inputs come from the U.S. Census Bureau (ACS 5-year estimates and the 2020 Decennial Census). Health and environmental inputs come from the CDC (PLACES and the Environmental Justice Index). Land cover comes from the USGS and EPA. Election-day and lead-up weather come from PRISM 4km daily grids and the NOAA Global Historical Climatology Network. Mail-voting and election-administration patterns come from the MIT Election Lab's Survey of the Performance of American Elections. Block-group crime detail comes from CrimeGrade. Internet data and modeling support provided by ISPreports.org.
Modeling and analysis by the BestNeighborhood data science team. Full methodology and findings: political spectrum map.
Methodology reviewed by the BestNeighborhood data team. Last updated May 2026.