River Point leans slightly Democratic by roughly 10 points: about 55% of voters vote Democratic and 45% Republican. These figures are model estimates: Rhode Island did not have precinct-level voting records available for training, so the numbers above come from demographic and health features rather than local ground truth.
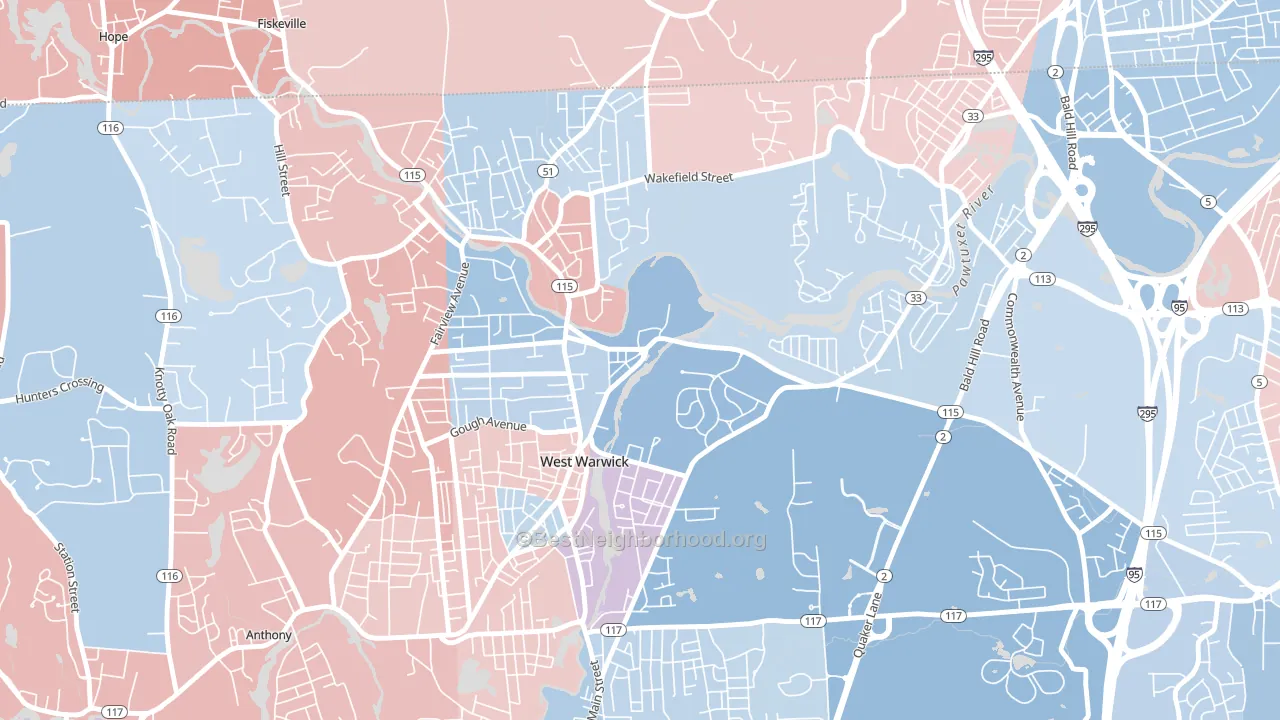
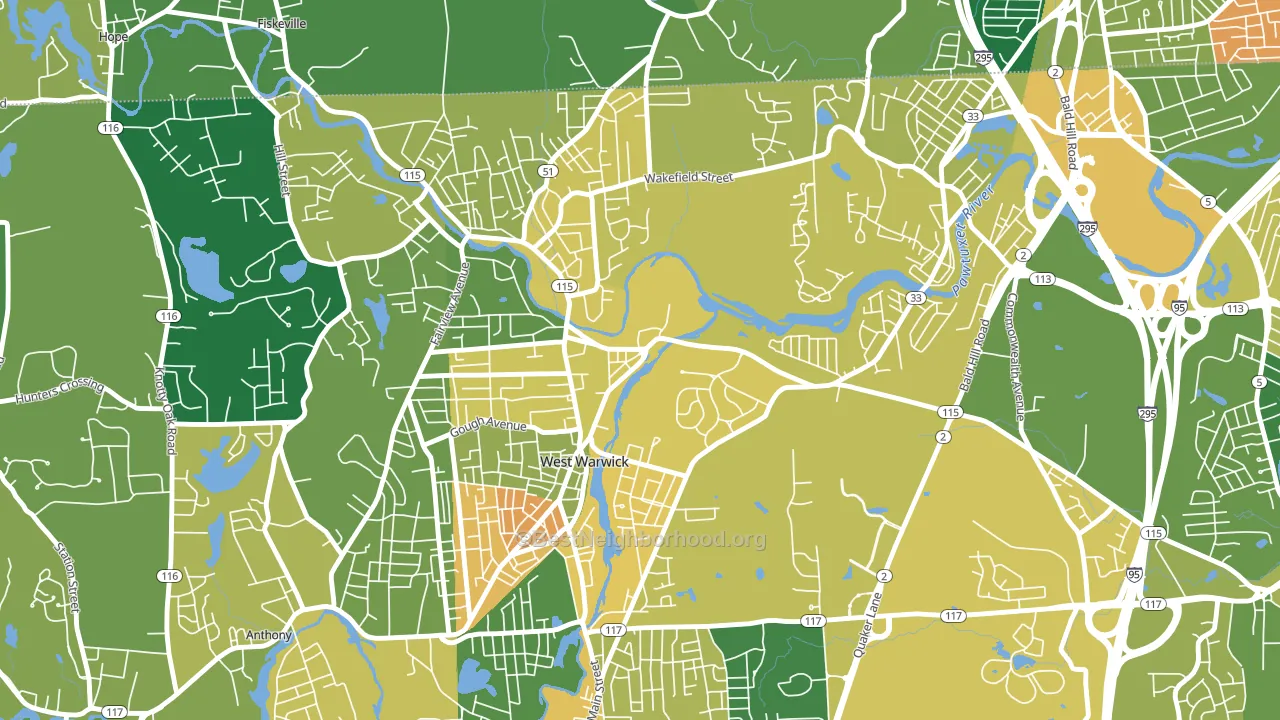
About 51% of adults in River Point typically vote, below the U.S. average of about 62%. Among adults in River Point, ~28% vote Democratic, ~23% Republican, and ~49% don't vote. The map below shows estimated turnout by block group.
How River Point compares
Among neighborhoods within 5 miles, River Point is the most Democratic-leaning.
Politically, River Point sits close to the rest of Rhode Island.
Why River Point leans the way it does
Density, race composition, education, and family structure all sit close to their national averages in River Point. None of them point strongly toward either party.
Homeownership and voter turnout
Places with renter-heavy households tend to turn out at a lower rate; River Point, West Warwick, RI sits in the bottom quarter nationally on this measure.
Why turnout in River Point looks the way it does
Renters vote less often than owners. About 66% of households in River Point rent, about 42 points above the U.S. average of 25%. Strong routine healthcare access lines up with higher turnout, and River Point sits in the top quarter on routine-care measures. Learn more about the findings and methodology on the political spectrum map.
Nearby Neighborhoods
Neighborhoods with Similar Populations
- Durant Manor, Oakland, CA D+60
- Merrill Park, Milwaukee, WI D+67
- Point Pleasant Manor, Brick, NJ R+31
- Dixon, Provo, UT R+14
- Wilshire Park, Midland, TX R+48
- Heritage East, Albuquerque, NM D+13
- Midwest, Detroit, MI D+84
- Park Hill, Moline, IL D+18
- Olympus Pointe, Roseville, CA Even
- Douglas, Elizabethton, TN R+46
Sources and methodology
Precinct-level voting records used to fit the model come from Rhode Island Board of Elections, distributed by the Voting and Election Science Team. Demographic inputs come from the U.S. Census Bureau (ACS 5-year estimates and the 2020 Decennial Census). Health and environmental inputs come from the CDC (PLACES and the Environmental Justice Index). Land cover comes from the USGS and EPA. Election-day and lead-up weather come from PRISM 4km daily grids and the NOAA Global Historical Climatology Network. Mail-voting and election-administration patterns come from the MIT Election Lab's Survey of the Performance of American Elections. Block-group crime detail comes from CrimeGrade. Internet data and modeling support provided by ISPreports.org.
Modeling and analysis by the BestNeighborhood data science team. RI did not have precinct-level voting records available for training, so the figures here come from extrapolation across demographic, health, and land-use features rather than local ground truth. Full methodology and findings: political spectrum map.
Methodology reviewed by the BestNeighborhood data team. Last updated May 2026.