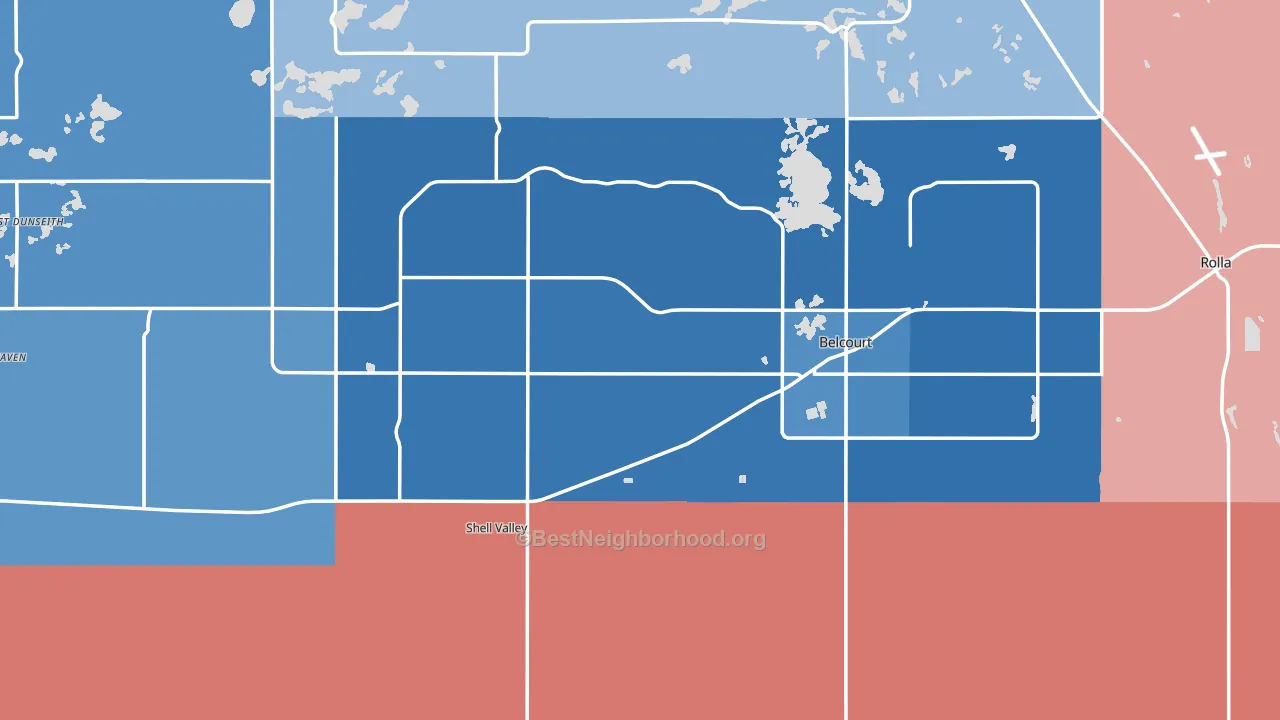
Rolette County leans heavily Democratic by roughly 34 points: about 67% of voters vote Democratic and 33% Republican.
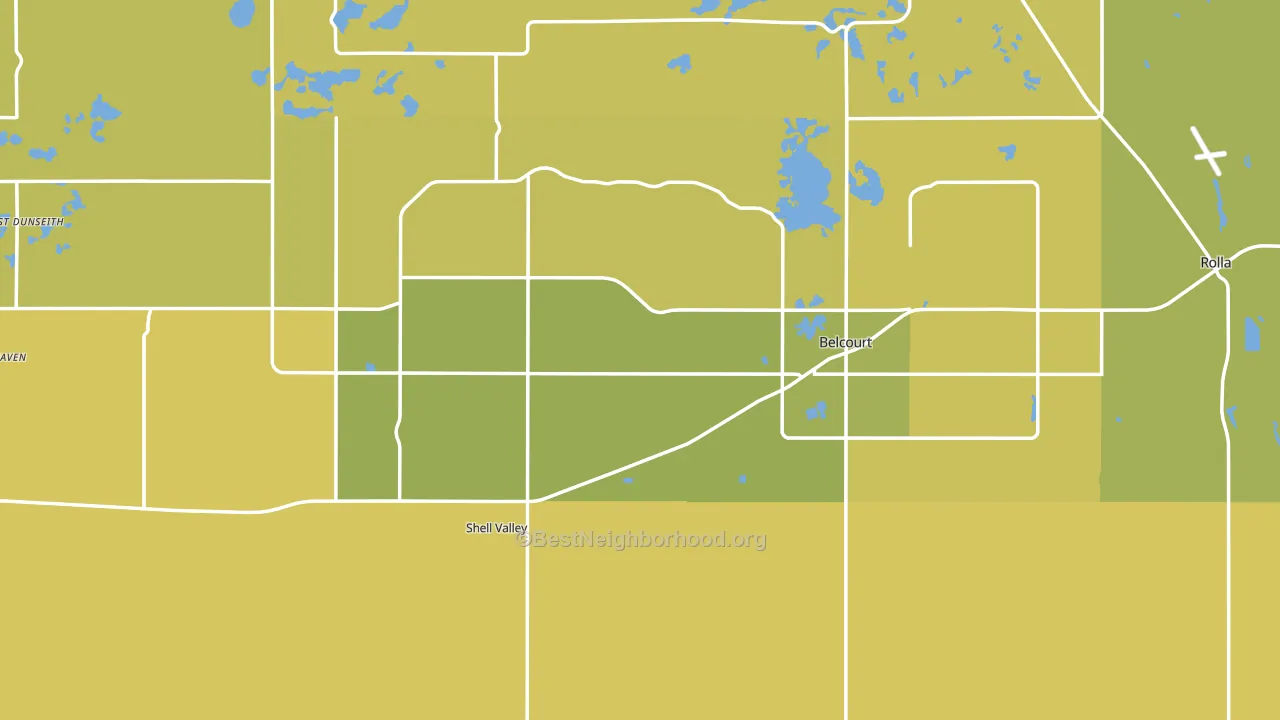
About 59% of adults in Rolette County typically vote, near the U.S. average of about 62%. Among adults in Rolette County, ~39% vote Democratic, ~19% Republican, and ~42% don't vote. The map below shows estimated turnout by block group.
How Rolette County compares
Among counties within 50 miles, Rolette County is the most Democratic-leaning.
Rolette County runs about 70 points more Democratic than North Dakota as a whole. North Dakota leans Republican overall, while Rolette County is one of the few Democratic-leaning pockets.
Politics vary noticeably by city within Rolette County. The east side runs the most Democratic (D+54) and the south side runs the most Republican (R+26), a spread of about 80 points.
Why Rolette County leans the way it does
This analysis examined 14,881 data points per county to find what predicts political lean and turnout. The items below are a few correlations that stood out for Rolette County, not a ranked or complete list of what matters most.
Rolette County votes against the grain of North Dakota. North Dakota leans Republican overall, while Rolette County runs about 70 points more Democratic. A high never-married share predicts Democratic voting, and about 48% of adults in Rolette County have never been married, in the top fraction of counties.
Cancer-screening access and voter turnout
Places with low colon-cancer-screening access tend to turn out at a lower rate; Rolette County, ND sits in the bottom tenth nationally on this measure. Cancer screening does not drive turnout; it reflects income, insurance, and healthcare access.
Why turnout in Rolette County looks the way it does
Areas with high food insecurity turn out at lower rates. About 30% of adults in Rolette County report food insecurity, about 14 points above the U.S. average of 16%. Renters vote less often than owners, and about 37% of households in Rolette County rent, above 89% of counties. Learn more about the findings and methodology on the political spectrum map.
Nearby Counties
- Towner County, ND R+45
- Pierce County, ND R+47
- Bottineau County, ND R+50
- McHenry County, ND R+61
- Benson County, ND D+2
- Cavalier County, ND R+48
- Ramsey County, ND R+30
- Renville County, ND R+65
- Ward County, ND R+32
- Wells County, ND R+58
Counties with Similar Populations
- Morrow County, OR R+36
- Rains County, TX R+75
- Newton County, TX R+61
- Union County, IA R+33
- Todd County, KY R+59
- Crawford County, GA R+48
- Glades County, FL R+47
- Edmonson County, KY R+67
- Pike County, IN R+55
- Blackford County, IN R+49
Sources and methodology
Precinct-level voting records used to fit the model come from North Dakota Secretary of State, Elections, distributed by the Voting and Election Science Team. Demographic inputs come from the U.S. Census Bureau (ACS 5-year estimates and the 2020 Decennial Census). Health and environmental inputs come from the CDC (PLACES and the Environmental Justice Index). Land cover comes from the USGS and EPA. Election-day and lead-up weather come from PRISM 4km daily grids and the NOAA Global Historical Climatology Network. Mail-voting and election-administration patterns come from the MIT Election Lab's Survey of the Performance of American Elections. Block-group crime detail comes from CrimeGrade. Internet data and modeling support provided by ISPreports.org.
Modeling and analysis by the BestNeighborhood data science team. Full methodology and findings: political spectrum map.
Methodology reviewed by the BestNeighborhood data team. Last updated May 2026.