Calumet Heights is a Democratic stronghold. About 93% of voters here vote Democratic and 7% Republican.
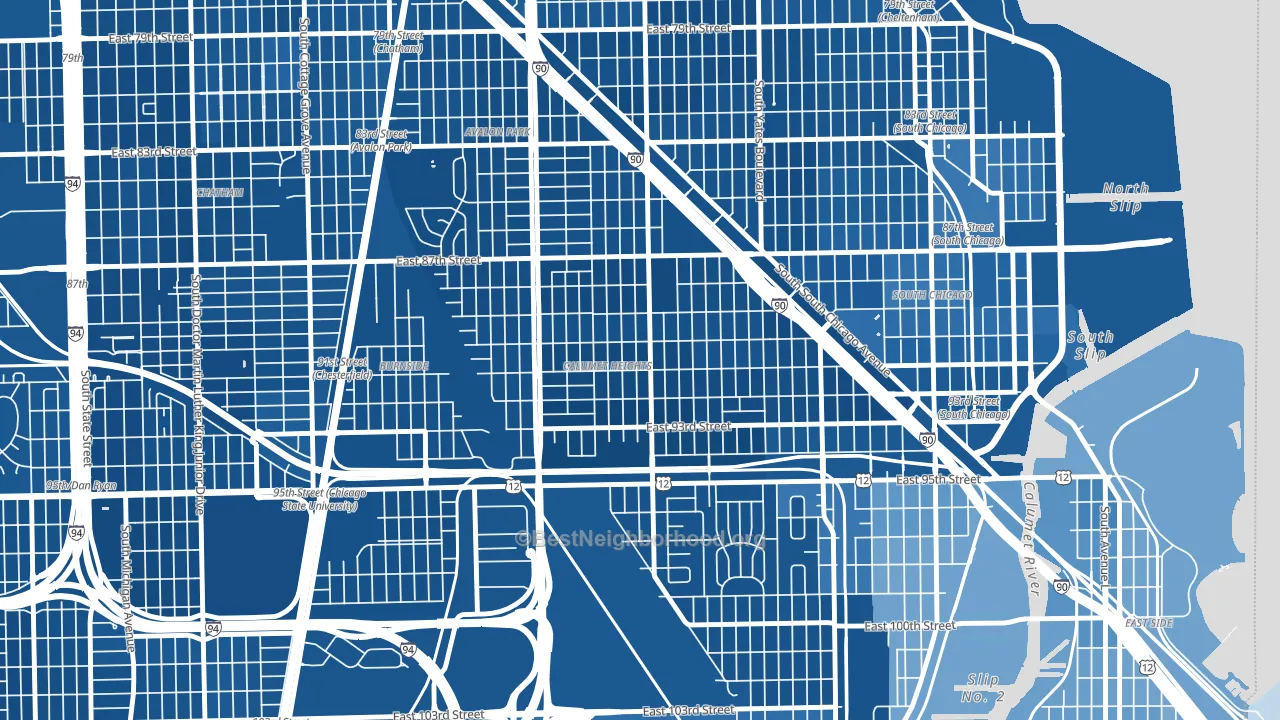
About 79% of adults in Calumet Heights typically vote, above the U.S. average of about 62%. Among adults in Calumet Heights, ~73% vote Democratic, ~6% Republican, and ~21% don't vote. The map below shows estimated turnout by block group.
How Calumet Heights compares
Among neighborhoods within 5 miles, Calumet Heights leans more Democratic than 26 of 29 neighbors.
Calumet Heights runs about 74 points more Democratic than Illinois as a whole.
Why Calumet Heights leans the way it does
This analysis examined 14,881 data points per neighborhood to find what predicts political lean and turnout. The items below are a few correlations that stood out for Calumet Heights, not a ranked or complete list of what matters most.
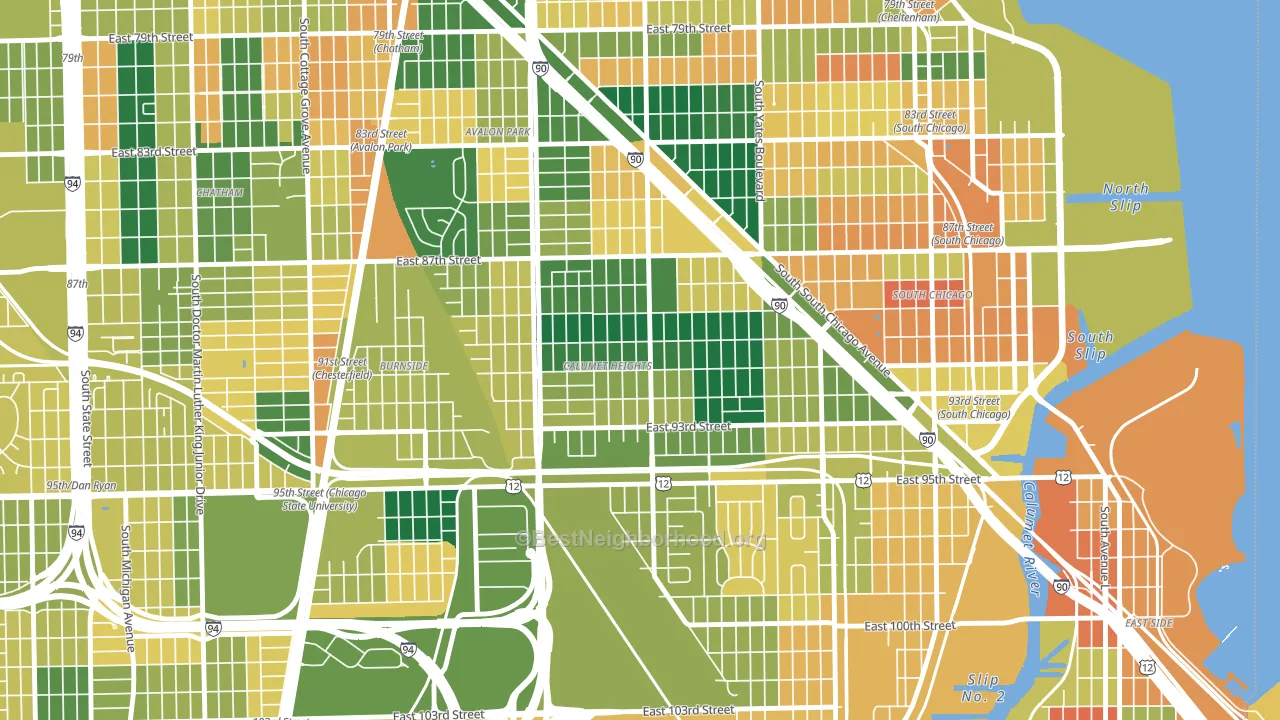
Dense areas vote Democratic. More than 99% of residents in Calumet Heights live in densely developed areas, about 64 points above the U.S. average of 36%.
Population density and Democratic lean
Places with high population density tend to lean Democratic; Calumet Heights, Chicago, IL sits in the top quarter nationally on this measure.
Why turnout in Calumet Heights looks the way it does
Turnout in Calumet Heights sits close to the national pattern. Routine healthcare access, homeownership, education, and food security all land near their national averages here. Learn more about the findings and methodology on the political spectrum map.
Nearby Neighborhoods
- Pill Hill, Chicago, IL D+85
- South Chicago, Chicago, IL D+76
- Avalon Park, Chicago, IL D+86
- Cheltenham, Chicago, IL D+80
- South Deering, Chicago, IL D+65
- The Bush, Chicago, IL D+68
- Italian Bowery, Chicago, IL D+82
- Avalon Highlands, Chicago, IL D+84
- Chatham, Chicago, IL D+85
- Windsor Park, Chicago, IL D+81
Neighborhoods with Similar Populations
- Sunset Hill, Staten Island, NY R+14
- Oak View, Huntington Beach, CA D+13
- Greater Harmony Hills, San Antonio, TX D+14
- Midtown, Little Rock, AR D+32
- Pacific Edison, Glendale, CA D+18
- Lowry Hill East, Minneapolis, MN D+75
- Ducktown, Chicago, IL D+35
- Belgravia Terrace, Chicago, IL D+58
- Snail, Sunnyvale, CA D+33
- DMV, San Bernardino, CA D+27
Sources and methodology
Precinct-level voting records used to fit the model come from Illinois State Board of Elections, distributed by the Voting and Election Science Team. Demographic inputs come from the U.S. Census Bureau (ACS 5-year estimates and the 2020 Decennial Census). Health and environmental inputs come from the CDC (PLACES and the Environmental Justice Index). Land cover comes from the USGS and EPA. Election-day and lead-up weather come from PRISM 4km daily grids and the NOAA Global Historical Climatology Network. Mail-voting and election-administration patterns come from the MIT Election Lab's Survey of the Performance of American Elections. Block-group crime detail comes from CrimeGrade. Internet data and modeling support provided by ISPreports.org.
Modeling and analysis by the BestNeighborhood data science team. Full methodology and findings: political spectrum map.
Methodology reviewed by the BestNeighborhood data team. Last updated May 2026.