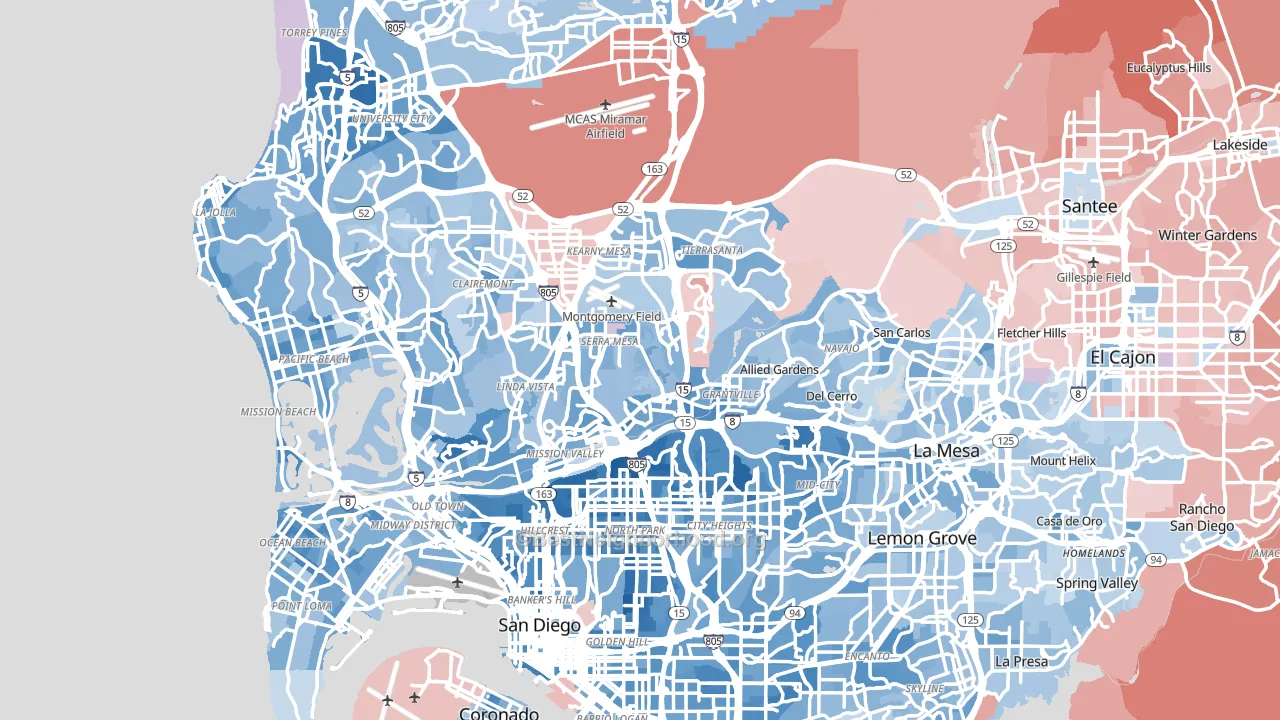
San Diego leans Democratic by roughly 18 points: about 59% of voters vote Democratic and 41% Republican.
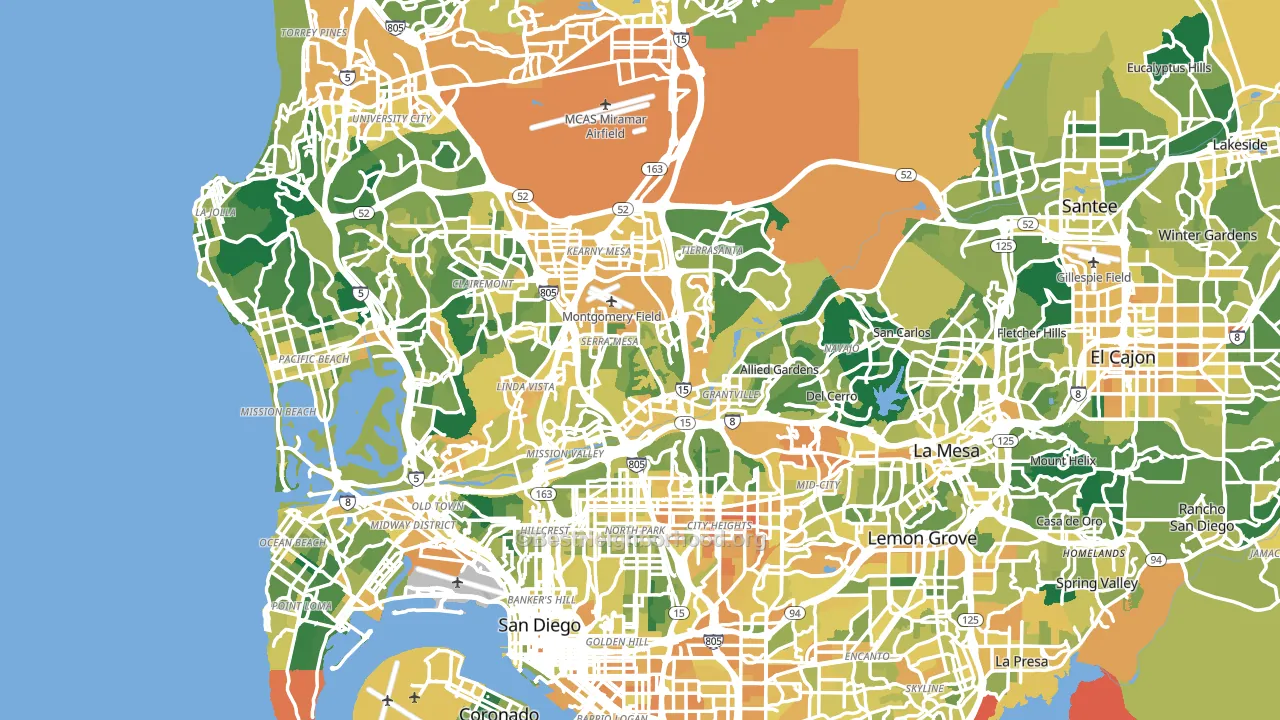
About 62% of adults in the San Diego area typically vote, near the U.S. average of about 62%. Among adults in the San Diego area, ~37% vote Democratic, ~25% Republican, and ~38% don't vote. The map below shows estimated turnout by block group.
How San Diego compares
Among cities within 25 miles, San Diego leans more Democratic than 20 of 32 neighbors.
Politically, San Diego sits close to the rest of California.
Politics vary noticeably by neighborhood within San Diego. The south side runs the most Democratic (D+33) and the northeast side runs the most Republican (R+9), a spread of about 43 points.
Why San Diego leans the way it does
This analysis examined 14,881 data points per city to find what predicts political lean and turnout. The items below are a few correlations that stood out for San Diego, not a ranked or complete list of what matters most.
Dense areas vote Democratic. About 87% of residents in the San Diego area live in densely developed areas, about 51 points above the U.S. average of 36%. High college attainment predicts Democratic voting, and San Diego sits in the top quarter (about 42%, above 89% of cities). A high never-married share predicts Democratic voting, and about 36% of adults in the San Diego area have never been married, above 89% of cities.
Walkability and Democratic lean
Places with a highly walkable street grid tend to lean Democratic; San Diego, CA sits in the top tenth nationally on this measure. A walkable street grid does not change how people vote; it mostly reflects how urban a place is.
Why turnout in San Diego looks the way it does
Renters vote less often than owners. About 44% of households in the San Diego area rent, about 19 points above the U.S. average of 25%. Crowded housing lines up with lower turnout, and about 7% of homes in the San Diego area have more than one occupant per room, above 93% of cities. Learn more about the findings and methodology on the political spectrum map.
Nearby Cities
- La Mesa, CA D+24
- Lemon Grove, CA D+22
- La Jolla, CA D+39
- Coronado, CA D+15
- National City, CA D+24
- Santee, CA R+9
- Casa de Oro-Mount Helix, CA D+11
- Spring Valley, CA D+11
- La Presa, CA D+18
- Bostonia, CA R+8
Cities with Similar Populations
- Tampa, FL R+6
- Denver, CO D+23
- Minneapolis, MN D+19
- Baltimore, MD D+29
- St. Louis, MO D+6
- Brooklyn, NY D+34
- Orlando, FL D+3
- Charlotte, NC D+4
- Seattle, WA D+30
- San Antonio, TX D+4
Sources and methodology
Precinct-level voting records used to fit the model come from California Secretary of State, Elections, distributed by the Voting and Election Science Team. Demographic inputs come from the U.S. Census Bureau (ACS 5-year estimates and the 2020 Decennial Census). Health and environmental inputs come from the CDC (PLACES and the Environmental Justice Index). Land cover comes from the USGS and EPA. Election-day and lead-up weather come from PRISM 4km daily grids and the NOAA Global Historical Climatology Network. Mail-voting and election-administration patterns come from the MIT Election Lab's Survey of the Performance of American Elections. Block-group crime detail comes from CrimeGrade. Internet data and modeling support provided by ISPreports.org.
Modeling and analysis by the BestNeighborhood data science team. Full methodology and findings: political spectrum map.
Methodology reviewed by the BestNeighborhood data team. Last updated May 2026.