Seaport leans Democratic by roughly 28 points: about 64% of voters vote Democratic and 36% Republican.
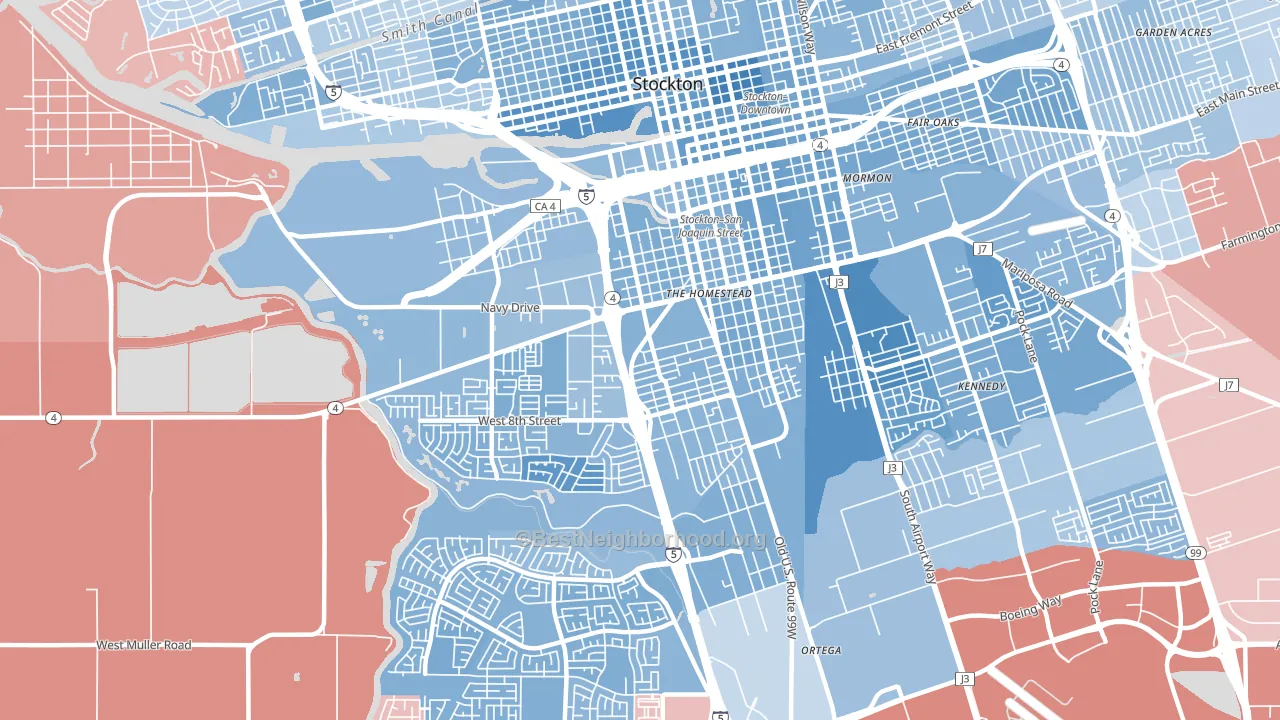
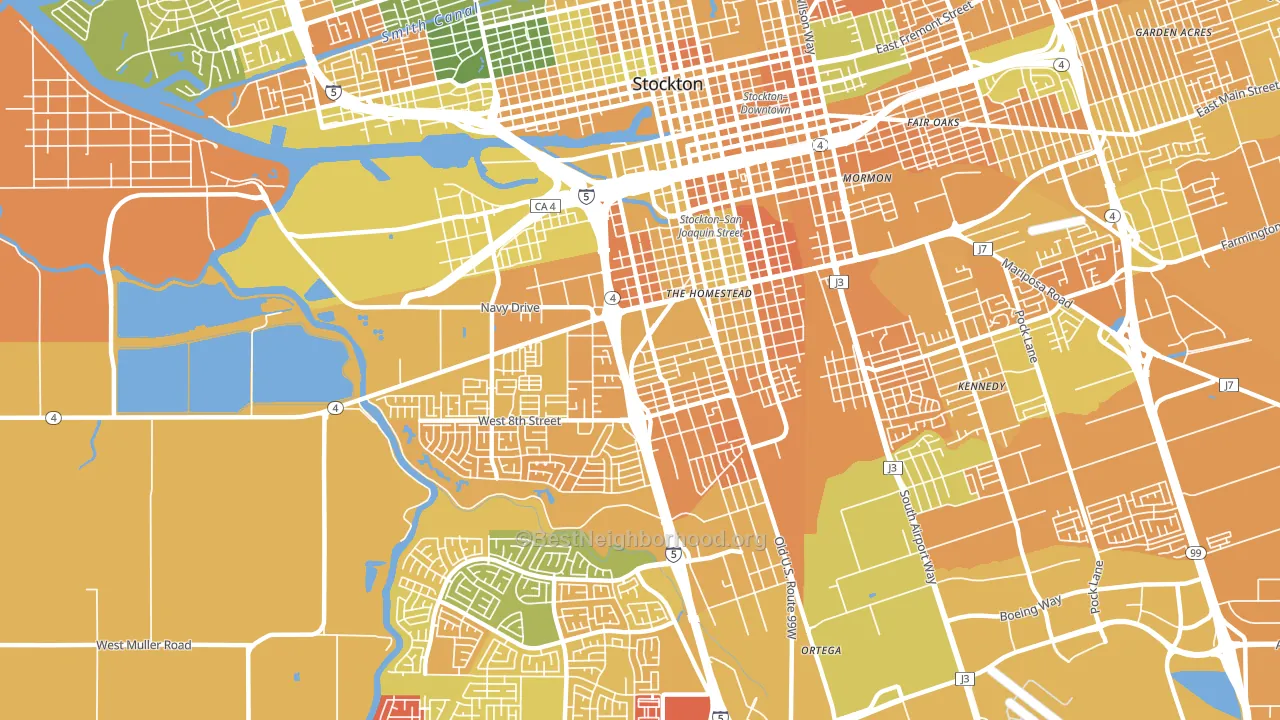
About 34% of adults in Seaport typically vote, below the U.S. average of about 62%. Among adults in Seaport, ~22% vote Democratic, ~12% Republican, and ~66% don't vote. The map below shows estimated turnout by block group.
How Seaport compares
Among neighborhoods within 5 miles, Seaport leans more Democratic than 4 of 5 neighbors.
Seaport runs about 7 points more Democratic than California as a whole.
Why Seaport leans the way it does
This analysis examined 14,881 data points per neighborhood to find what predicts political lean and turnout. The items below are a few correlations that stood out for Seaport, not a ranked or complete list of what matters most.
Areas with many never-married adults vote Democratic. About 49% of adults in Seaport have never been married, about 19 points above the U.S. average of 29%.
Cancer-screening access and voter turnout
Places with low colon-cancer-screening access tend to turn out at a lower rate; Seaport, Stockton, CA sits in the bottom tenth nationally on this measure. Cancer screening does not drive turnout; it reflects income, insurance, and healthcare access.
Why turnout in Seaport looks the way it does
Areas with limited routine healthcare access turn out at lower rates. Seaport is in the bottom quarter nationally for routine-care measures such as insurance coverage, preventive screenings, and dental visits. The dental-visit rate here is about 43%, about 19 points below the California average of 62%. High food insecurity lines up with lower turnout, and about 38% of adults in Seaport report food insecurity, above 92% of neighborhoods. Low high-school completion lines up with lower turnout, and about 58% of adults in Seaport have completed high school, in the bottom fraction of neighborhoods. Learn more about the findings and methodology on the political spectrum map.
Nearby Neighborhoods
- Civic Center, Stockton, CA D+34
- Weston Ranch, Stockton, CA D+24
- Park, Stockton, CA D+26
- Pacific, Stockton, CA D+24
- Brookside, Stockton, CA D+12
- Lakeview, Stockton, CA D+20
- Lincoln Village Proper, Stockton, CA D+2
- Lincoln Village West, Stockton, CA D+11
- Valley Oak, Stockton, CA D+12
- Sherwoods Manor, Stockton, CA D+8
Neighborhoods with Similar Populations
- East Side, Long Beach, CA D+52
- South Shore, Chicago, IL D+83
- Brighton Park, Chicago, IL D+32
- Charter Oak, Covina, CA D+9
- Glendale, Queens, NY R+8
- Clairemont Mesa, San Diego, CA D+24
- Throgs Neck-Edgewater Park, Bronx, NY D+4
- Bustleton, Philadelphia, PA R+3
- Oakland Gardens, Queens, NY Even
- University District, Seattle, WA D+67
Sources and methodology
Precinct-level voting records used to fit the model come from California Secretary of State, Elections, distributed by the Voting and Election Science Team. Demographic inputs come from the U.S. Census Bureau (ACS 5-year estimates and the 2020 Decennial Census). Health and environmental inputs come from the CDC (PLACES and the Environmental Justice Index). Land cover comes from the USGS and EPA. Election-day and lead-up weather come from PRISM 4km daily grids and the NOAA Global Historical Climatology Network. Mail-voting and election-administration patterns come from the MIT Election Lab's Survey of the Performance of American Elections. Block-group crime detail comes from CrimeGrade. Internet data and modeling support provided by ISPreports.org.
Modeling and analysis by the BestNeighborhood data science team. Full methodology and findings: political spectrum map.
Methodology reviewed by the BestNeighborhood data team. Last updated May 2026.