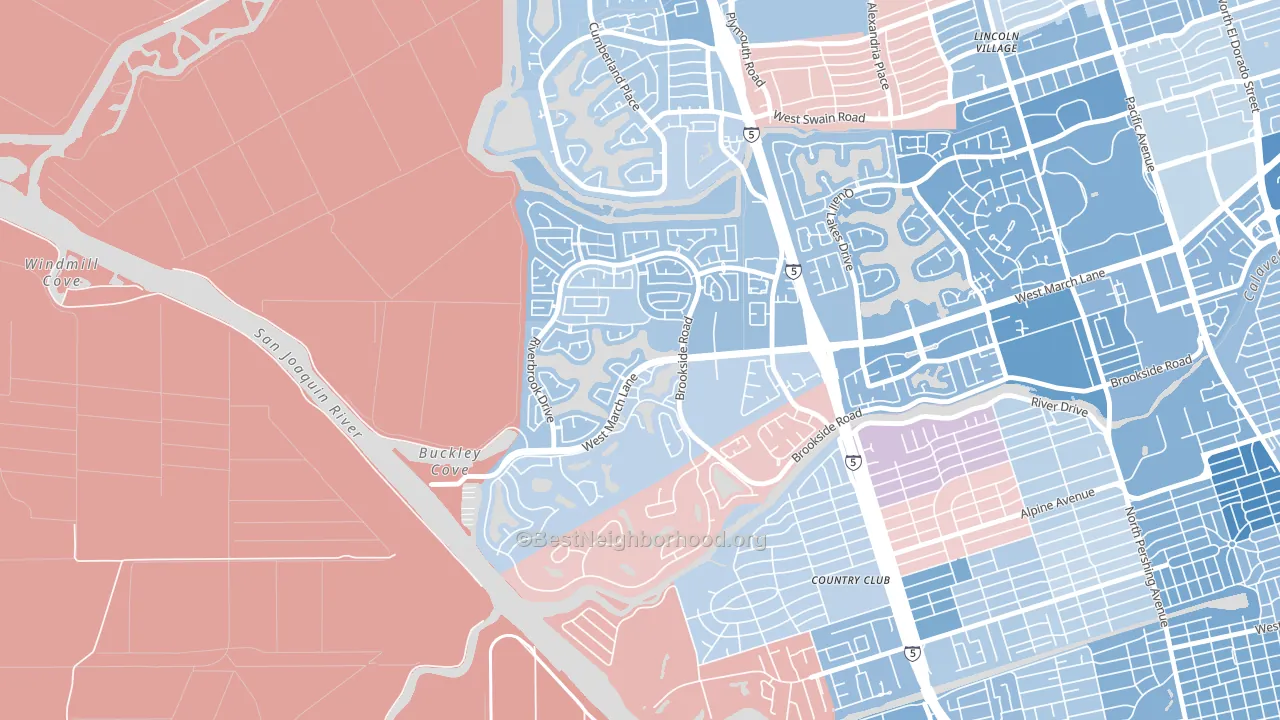
Brookside leans slightly Democratic by roughly 12 points: about 56% of voters vote Democratic and 44% Republican.
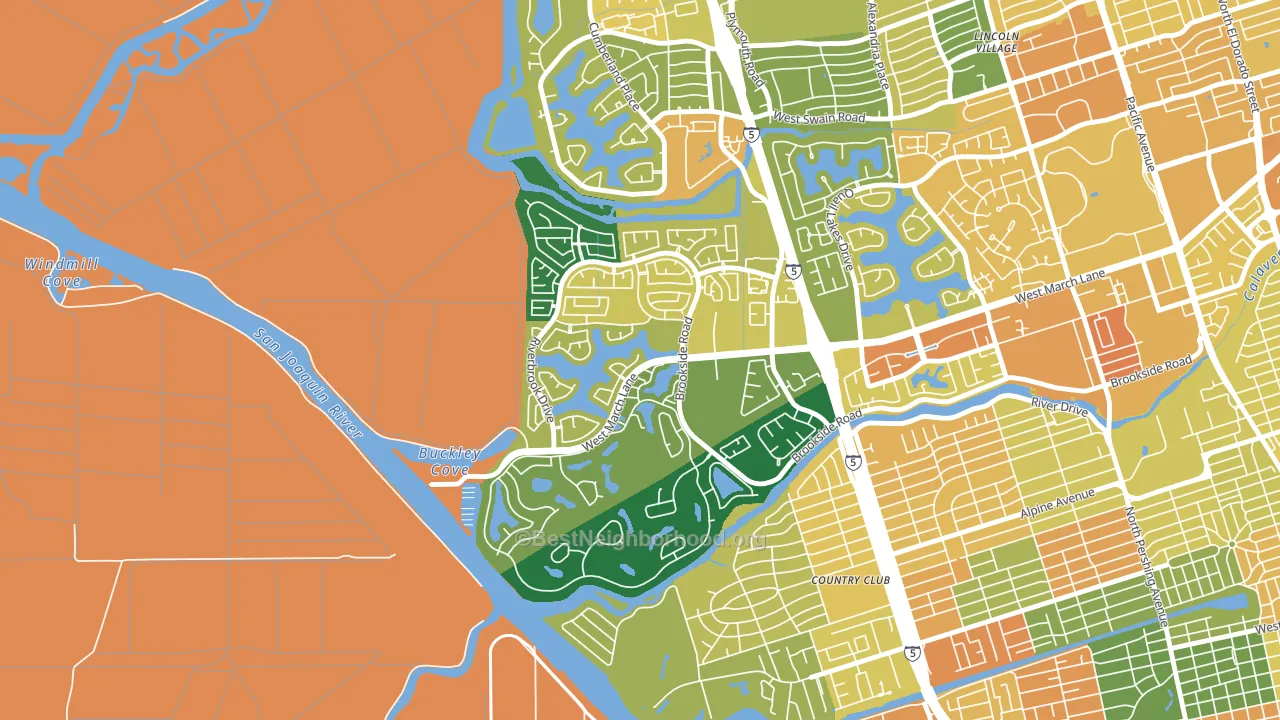
About 74% of adults in Brookside typically vote, above the U.S. average of about 62%. Among adults in Brookside, ~41% vote Democratic, ~33% Republican, and ~26% don't vote. The map below shows estimated turnout by block group.
How Brookside compares
Among neighborhoods within 5 miles, Brookside leans more Democratic than 4 of 12 neighbors.
Brookside runs about 8 points more Republican than California as a whole.
Politics vary noticeably by block within Brookside. The northwest side is the most Democratic-leaning (D+20) and the southeast side is the least Democratic-leaning (Even), a spread of about 18 points.
Why Brookside leans the way it does
This analysis examined 14,881 data points per neighborhood to find what predicts political lean and turnout. The items below are a few correlations that stood out for Brookside, not a ranked or complete list of what matters most.
Areas with high college attainment vote Democratic. About 59% of adults in Brookside hold a bachelor's degree, about 31 points above the U.S. average of 28%.
Population density and Democratic lean
Places with high population density tend to lean Democratic; Brookside, Stockton, CA sits above the national average on this measure.
Why turnout in Brookside looks the way it does
Areas with strong routine healthcare access turn out at higher rates. Brookside is in the top quarter nationally for routine-care measures such as insurance coverage, preventive screenings, and dental visits. The dental-visit rate here is about 71%, about 11 points above the U.S. average of 60%. Learn more about the findings and methodology on the political spectrum map.
Nearby Neighborhoods
- Lincoln Village West, Stockton, CA D+11
- Lincoln Village Proper, Stockton, CA D+2
- Lakeview, Stockton, CA D+20
- Pacific, Stockton, CA D+24
- Sherwoods Manor, Stockton, CA D+8
- Sherwood Manor, Stockton, CA D+14
- Bear Creek, Stockton, CA D+15
- Stonewood, Stockton, CA D+12
- Civic Center, Stockton, CA D+34
- Spanos Park, Stockton, CA D+6
Neighborhoods with Similar Populations
- Brentwood, Austin, TX D+59
- Shenandoah, Aurora, CO D+23
- Green Lake, Seattle, WA D+76
- Sans Pareil, Jacksonville, FL R+3
- Douglas Park, Arlington, VA D+53
- Bulls Head, Staten Island, NY R+31
- North Shore, Haleiwa, HI D+7
- Hillside, Daly City, CA D+39
- Highland-Stoner Hill, Shreveport, LA D+39
- El Toro Marine Air Station, Irvine, CA D+18
Sources and methodology
Precinct-level voting records used to fit the model come from California Secretary of State, Elections, distributed by the Voting and Election Science Team. Demographic inputs come from the U.S. Census Bureau (ACS 5-year estimates and the 2020 Decennial Census). Health and environmental inputs come from the CDC (PLACES and the Environmental Justice Index). Land cover comes from the USGS and EPA. Election-day and lead-up weather come from PRISM 4km daily grids and the NOAA Global Historical Climatology Network. Mail-voting and election-administration patterns come from the MIT Election Lab's Survey of the Performance of American Elections. Block-group crime detail comes from CrimeGrade. Internet data and modeling support provided by ISPreports.org.
Modeling and analysis by the BestNeighborhood data science team. Full methodology and findings: political spectrum map.
Methodology reviewed by the BestNeighborhood data team. Last updated May 2026.