Seminary is a Democratic stronghold. About 89% of voters here vote Democratic and 11% Republican.
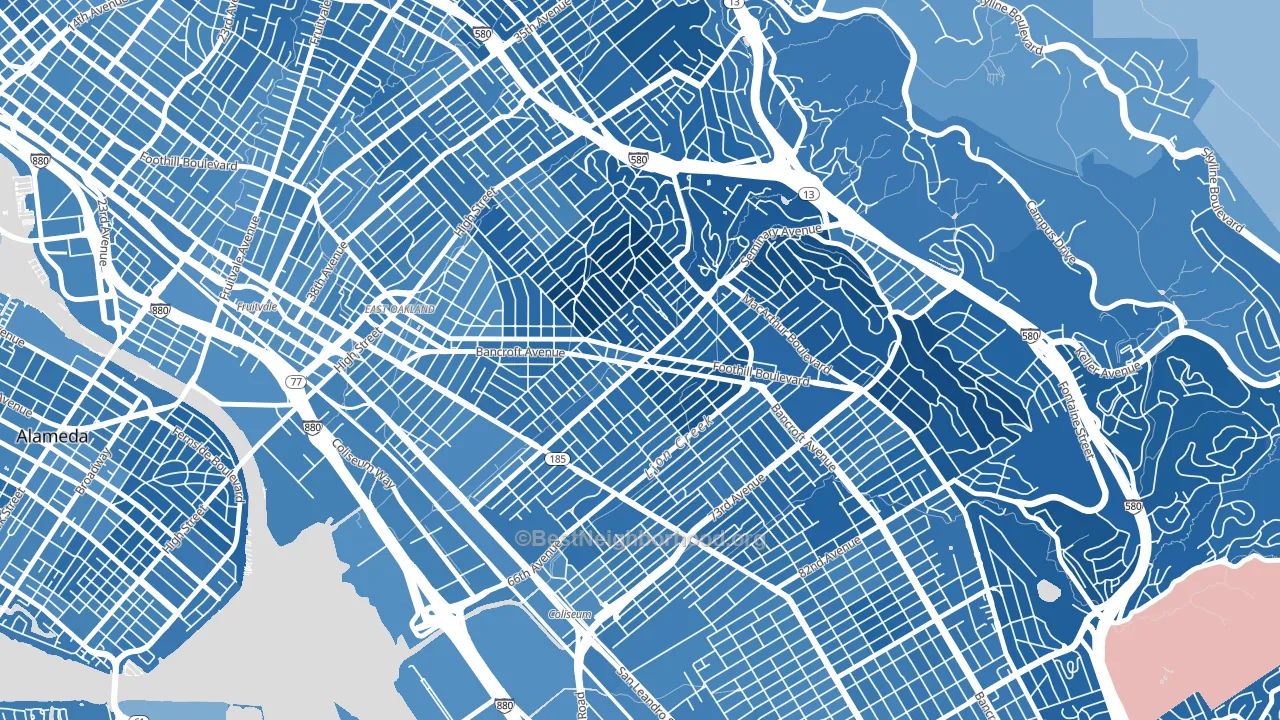
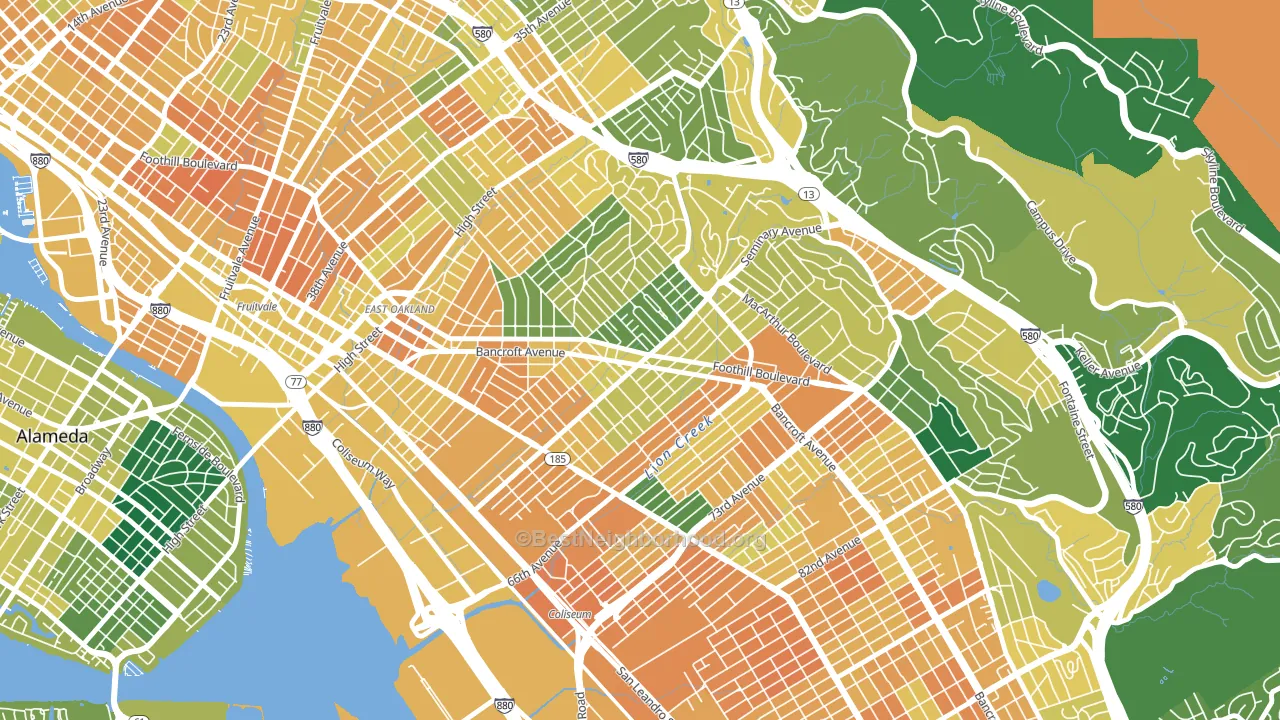
About 53% of adults in Seminary typically vote, below the U.S. average of about 62%. Among adults in Seminary, ~47% vote Democratic, ~6% Republican, and ~47% don't vote. The map below shows estimated turnout by block group.
How Seminary compares
Among neighborhoods within 5 miles, Seminary leans more Democratic than 48 of 56 neighbors.
Seminary runs about 57 points more Democratic than California as a whole.
Politics vary noticeably by block within Seminary. The northwest side is the most Democratic-leaning (D+97) and the southwest side is the least Democratic-leaning (D+64), a spread of about 33 points.
Why Seminary leans the way it does
This analysis examined 14,881 data points per neighborhood to find what predicts political lean and turnout. The items below are a few correlations that stood out for Seminary, not a ranked or complete list of what matters most.
Density combined with diversity predicts Democratic voting. Non-Hispanic white share in Seminary is about 20%, about 52 points below the U.S. average of 72%.
Paved land cover and Democratic lean
Places with extensive paved surfaces tend to lean Democratic; Seminary, Oakland, CA sits in the top quarter nationally on this measure. Paved ground does not change how people vote; it mostly reflects how urban and built-up a place is.
Why turnout in Seminary looks the way it does
Crowded housing lines up with lower turnout. About 12% of homes in Seminary have more than one occupant per room, above 94% of neighborhoods. Learn more about the findings and methodology on the political spectrum map.
Nearby Neighborhoods
- Melrose, Oakland, CA D+59
- Millsmont, Oakland, CA D+84
- Coliseum, Oakland, CA D+59
- Arroyo Viejo, Oakland, CA D+66
- Eastmont, Oakland, CA D+72
- Fitchburg, Oakland, CA D+59
- Allendale, Oakland, CA D+63
- Upper Laurel, Oakland, CA D+77
- Laurel, Oakland, CA D+70
- Webster, Oakland, CA D+60
Neighborhoods with Similar Populations
- Woodlawn, Pawtucket, RI D+40
- Harvey Park, Denver, CO D+34
- Adams Park, Atlanta, GA D+86
- River West, Bend, OR D+45
- Fairlington-Shirlington, Arlington, VA D+64
- Bay View, Norfolk, VA D+19
- Surprise Farms, Surprise, AZ R+23
- Schuylerville, Bronx, NY D+11
- Lauderdale Lakes West Gate, Lauderdale Lakes, FL D+65
- Harris-Houston, Charlotte, NC D+56
Sources and methodology
Precinct-level voting records used to fit the model come from California Secretary of State, Elections, distributed by the Voting and Election Science Team. Demographic inputs come from the U.S. Census Bureau (ACS 5-year estimates and the 2020 Decennial Census). Health and environmental inputs come from the CDC (PLACES and the Environmental Justice Index). Land cover comes from the USGS and EPA. Election-day and lead-up weather come from PRISM 4km daily grids and the NOAA Global Historical Climatology Network. Mail-voting and election-administration patterns come from the MIT Election Lab's Survey of the Performance of American Elections. Block-group crime detail comes from CrimeGrade. Internet data and modeling support provided by ISPreports.org.
Modeling and analysis by the BestNeighborhood data science team. Full methodology and findings: political spectrum map.
Methodology reviewed by the BestNeighborhood data team. Last updated May 2026.