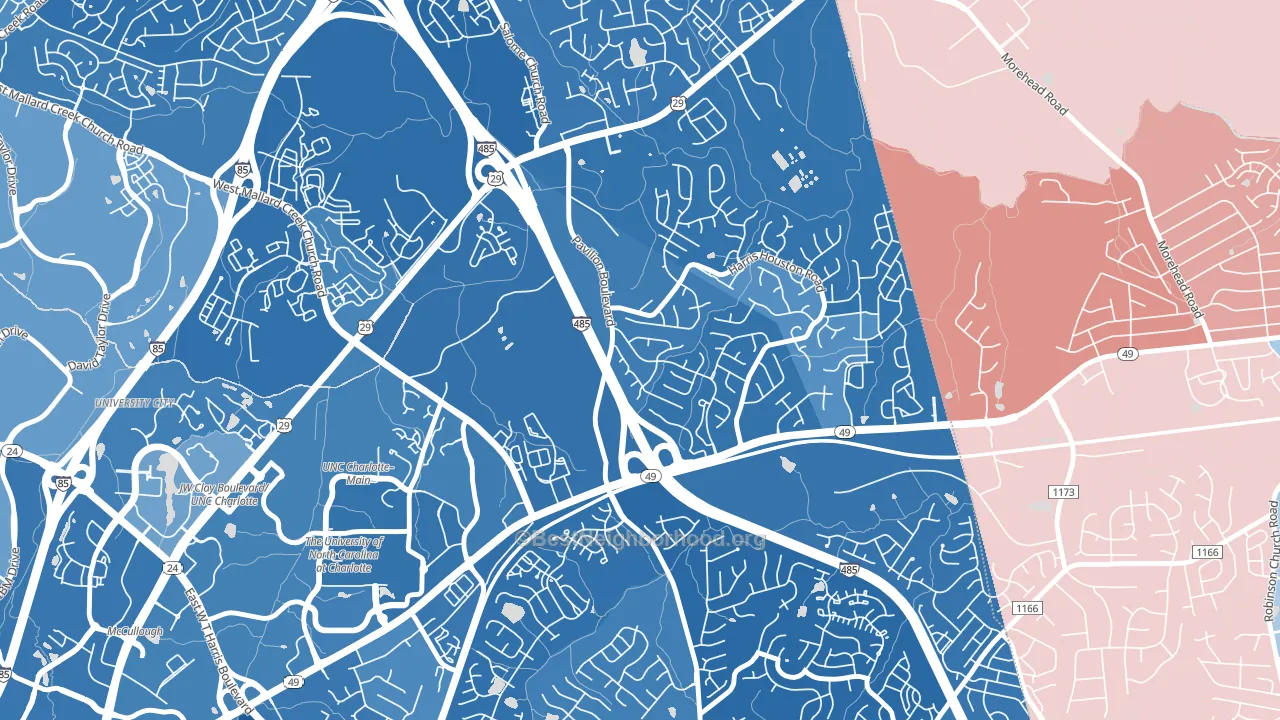
Harris-Houston is a Democratic stronghold. About 78% of voters here vote Democratic and 22% Republican.
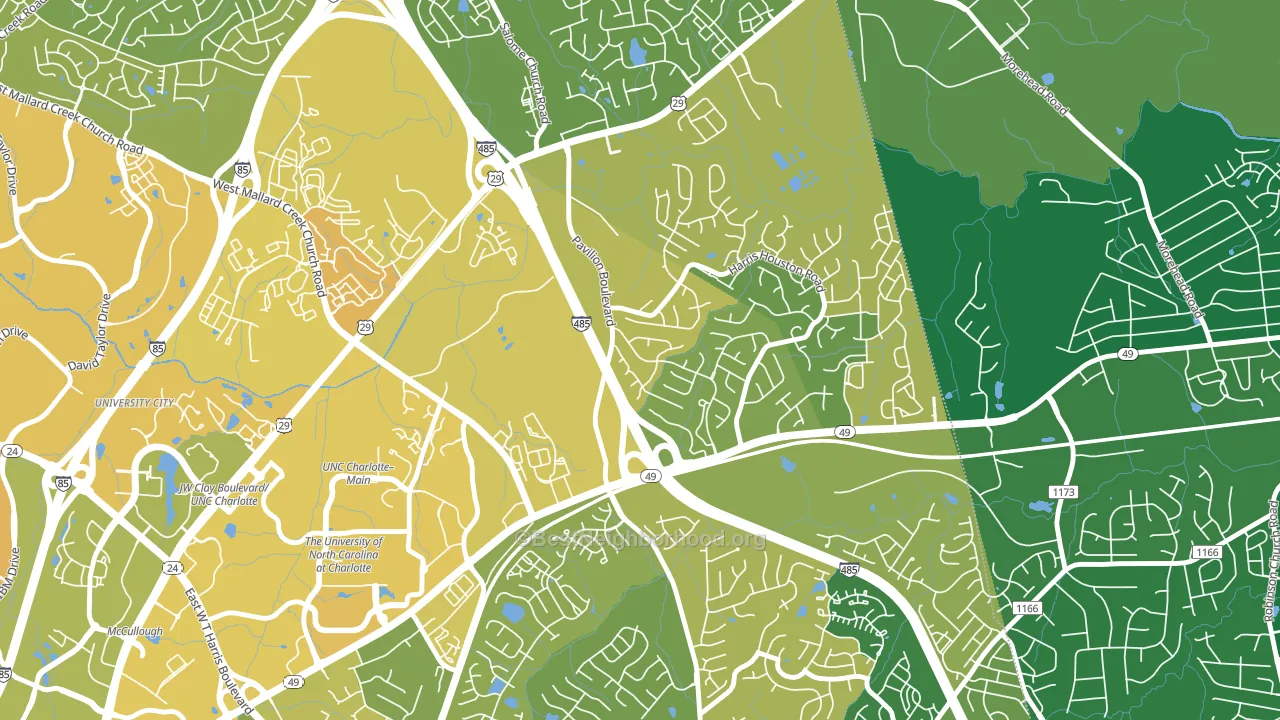
About 62% of adults in Harris-Houston typically vote, near the U.S. average of about 62%. Among adults in Harris-Houston, ~48% vote Democratic, ~14% Republican, and ~38% don't vote. The map below shows estimated turnout by block group.
How Harris-Houston compares
Among neighborhoods within 5 miles, Harris-Houston leans more Democratic than 4 of 8 neighbors.
Harris-Houston runs about 60 points more Democratic than North Carolina as a whole. North Carolina leans Republican overall, while Harris-Houston is one of the few Democratic-leaning pockets.
Why Harris-Houston leans the way it does
This analysis examined 14,881 data points per neighborhood to find what predicts political lean and turnout. The items below are a few correlations that stood out for Harris-Houston, not a ranked or complete list of what matters most.
Harris-Houston votes against the grain of North Carolina. North Carolina leans Republican overall, while Harris-Houston runs about 60 points more Democratic. A high never-married share predicts Democratic voting, and about 59% of adults in Harris-Houston have never been married, above 92% of neighborhoods.
Adult arthritis and voter turnout
Places with a low adult-arthritis rate tend to turn out at a higher rate; Harris-Houston, Charlotte, NC sits in the bottom tenth nationally on this measure. Arthritis does not drive turnout; it reflects the age and health profile of an area.
Why turnout in Harris-Houston looks the way it does
Turnout in Harris-Houston sits close to the national pattern. Routine healthcare access, homeownership, education, and food security all land near their national averages here. Learn more about the findings and methodology on the political spectrum map.
Nearby Neighborhoods
- University City South, Charlotte, NC D+52
- Mallard Creek-Withrow Downs, Charlotte, NC D+60
- Back Creek Church Road, Charlotte, NC D+62
- University City North, Charlotte, NC D+56
- Newell, Charlotte, NC D+66
- Newell South, Charlotte, NC D+44
- Mineral Springs-Rumble Road, Charlotte, NC D+62
- Prosperity Church Road, Charlotte, NC D+55
- Hidden Valley, Charlotte, NC D+68
- Plaza-Eastway, Charlotte, NC D+74
Neighborhoods with Similar Populations
- Surprise Farms, Surprise, AZ R+23
- Turtle Rock, Irvine, CA D+11
- Pine Point, Springfield, MA D+41
- Harbour Pointe, Mukilteo, WA D+22
- Coulwood West, Charlotte, NC D+42
- Woodlawn, Pawtucket, RI D+40
- Seminary, Oakland, CA D+77
- Harvey Park, Denver, CO D+34
- Bridgeland, Cypress, TX R+24
- Adams Park, Atlanta, GA D+86
Sources and methodology
Precinct-level voting records used to fit the model come from North Carolina State Board of Elections, distributed by the Voting and Election Science Team. Demographic inputs come from the U.S. Census Bureau (ACS 5-year estimates and the 2020 Decennial Census). Health and environmental inputs come from the CDC (PLACES and the Environmental Justice Index). Land cover comes from the USGS and EPA. Election-day and lead-up weather come from PRISM 4km daily grids and the NOAA Global Historical Climatology Network. Mail-voting and election-administration patterns come from the MIT Election Lab's Survey of the Performance of American Elections. Block-group crime detail comes from CrimeGrade. Internet data and modeling support provided by ISPreports.org.
Modeling and analysis by the BestNeighborhood data science team. Full methodology and findings: political spectrum map.
Methodology reviewed by the BestNeighborhood data team. Last updated May 2026.