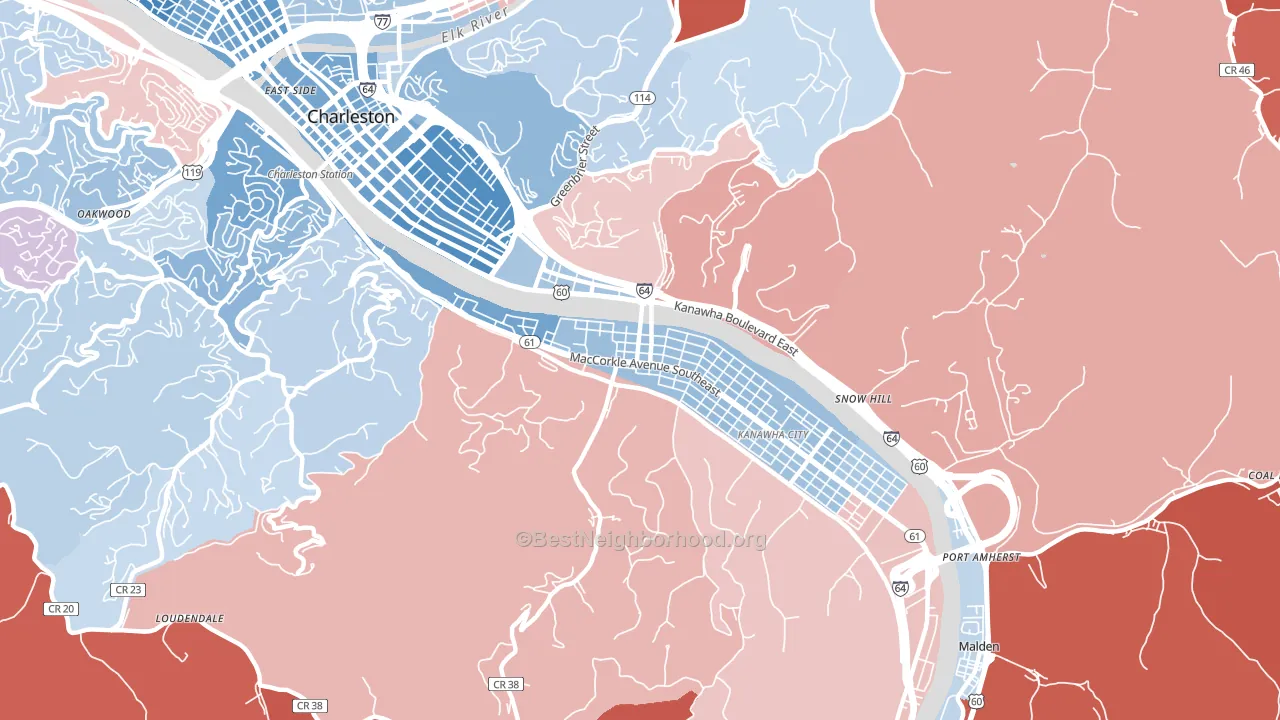
South Ruffner leans Democratic by roughly 24 points: about 62% of voters vote Democratic and 38% Republican.
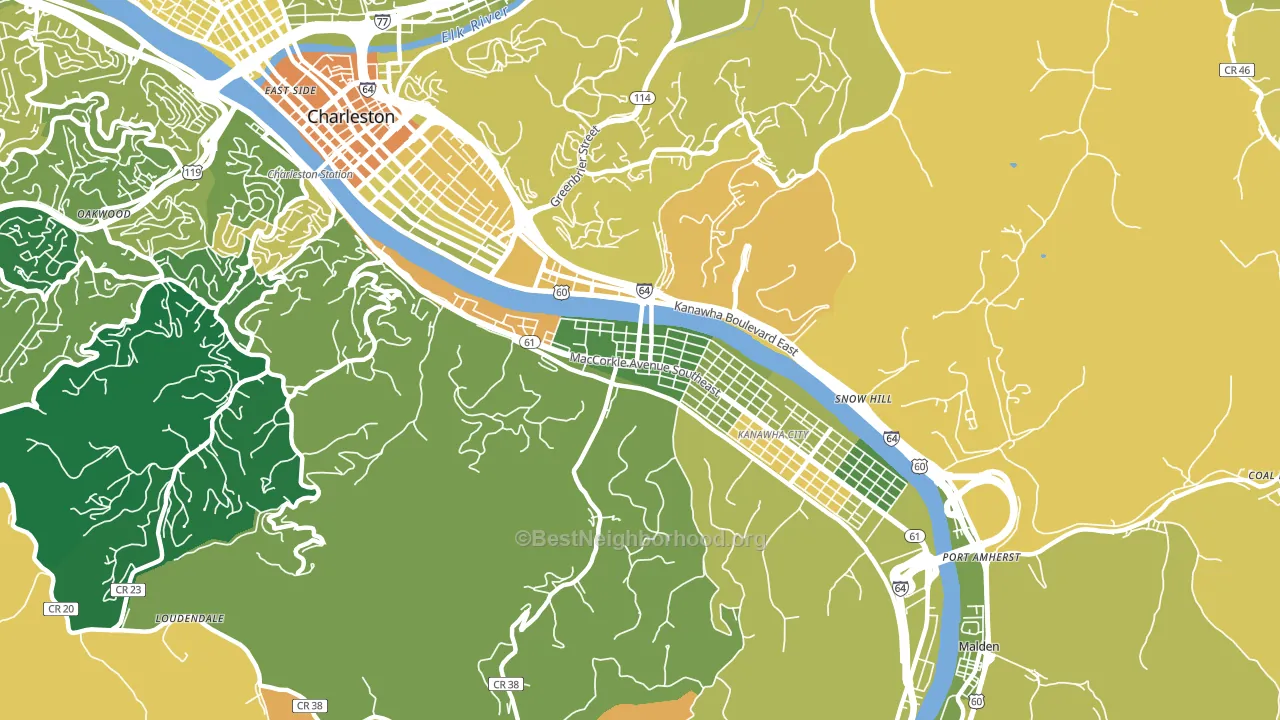
About 61% of adults in South Ruffner typically vote, near the U.S. average of about 62%. Among adults in South Ruffner, ~38% vote Democratic, ~23% Republican, and ~39% don't vote. The map below shows estimated turnout by block group.
How South Ruffner compares
South Ruffner sits in a sparsely populated area with few comparable neighborhoods nearby.
South Ruffner runs about 66 points more Democratic than West Virginia as a whole. West Virginia leans Republican overall, while South Ruffner is one of the few Democratic-leaning pockets.
Politics vary noticeably by block within South Ruffner. The northwest side is the most Democratic-leaning (D+30) and the north side is the least Democratic-leaning (D+17), a spread of about 13 points.
Why South Ruffner leans the way it does
This analysis examined 14,881 data points per neighborhood to find what predicts political lean and turnout. The items below are a few correlations that stood out for South Ruffner, not a ranked or complete list of what matters most.
Areas with high college attainment vote Democratic. About 70% of adults in South Ruffner hold a bachelor's degree, about 41 points above the U.S. average of 28%. South Ruffner runs against the grain of West Virginia, a Democratic-leaning pocket in a Republican-leaning state.
Adult arthritis and voter turnout
Places with a high adult-arthritis rate tend to turn out at a lower rate; South Ruffner, Charleston, WV sits in the top quarter nationally on this measure. Arthritis does not drive turnout; it reflects the age and health profile of an area.
Why turnout in South Ruffner looks the way it does
Areas with strong routine healthcare access turn out at higher rates. South Ruffner is in the top quarter nationally for routine-care measures such as insurance coverage, preventive screenings, and dental visits. The dental-visit rate here is about 68%, about 8 points above the U.S. average of 60%. Learn more about the findings and methodology on the political spectrum map.
Nearby Neighborhoods
- East End, Charleston, WV D+44
- West Side, Charleston, WV D+43
- Southside, Huntington, WV D+31
- West Huntington, Huntington, WV R+13
- Rankin Historic District, Ironton, OH R+24
- Beechwood, Parkersburg, WV R+25
- Glenbrook, Vienna, WV R+29
- Marietta Historic District, Marietta, OH Even
- 6th Ward, Portsmouth, OH R+46
- 4th Ward, Portsmouth, OH R+25
Neighborhoods with Similar Populations
- Downtown Chapel Hill, Chapel Hill, NC D+68
- Denver International Airport, Denver, CO D+45
- Sherwoods Manor, Stockton, CA D+8
- West Cloverdale, Boise, ID R+14
- Hibiscus, Azalea Park, FL D+10
- Orchidlands Estates, Keaau, HI D+6
- Woodville, North Lauderdale, FL D+51
- Ghost Town, Laredo, TX D+8
- Downtown North Lauderdale, North Lauderdale, FL D+51
- Blanco Gardens, San Marcos, TX D+24
Sources and methodology
Precinct-level voting records used to fit the model come from West Virginia Secretary of State, Elections, distributed by the Voting and Election Science Team. Demographic inputs come from the U.S. Census Bureau (ACS 5-year estimates and the 2020 Decennial Census). Health and environmental inputs come from the CDC (PLACES and the Environmental Justice Index). Land cover comes from the USGS and EPA. Election-day and lead-up weather come from PRISM 4km daily grids and the NOAA Global Historical Climatology Network. Mail-voting and election-administration patterns come from the MIT Election Lab's Survey of the Performance of American Elections. Block-group crime detail comes from CrimeGrade. Internet data and modeling support provided by ISPreports.org.
Modeling and analysis by the BestNeighborhood data science team. Full methodology and findings: political spectrum map.
Methodology reviewed by the BestNeighborhood data team. Last updated May 2026.