West Cloverdale leans slightly Republican by roughly 14 points: about 43% of voters vote Democratic and 57% Republican.
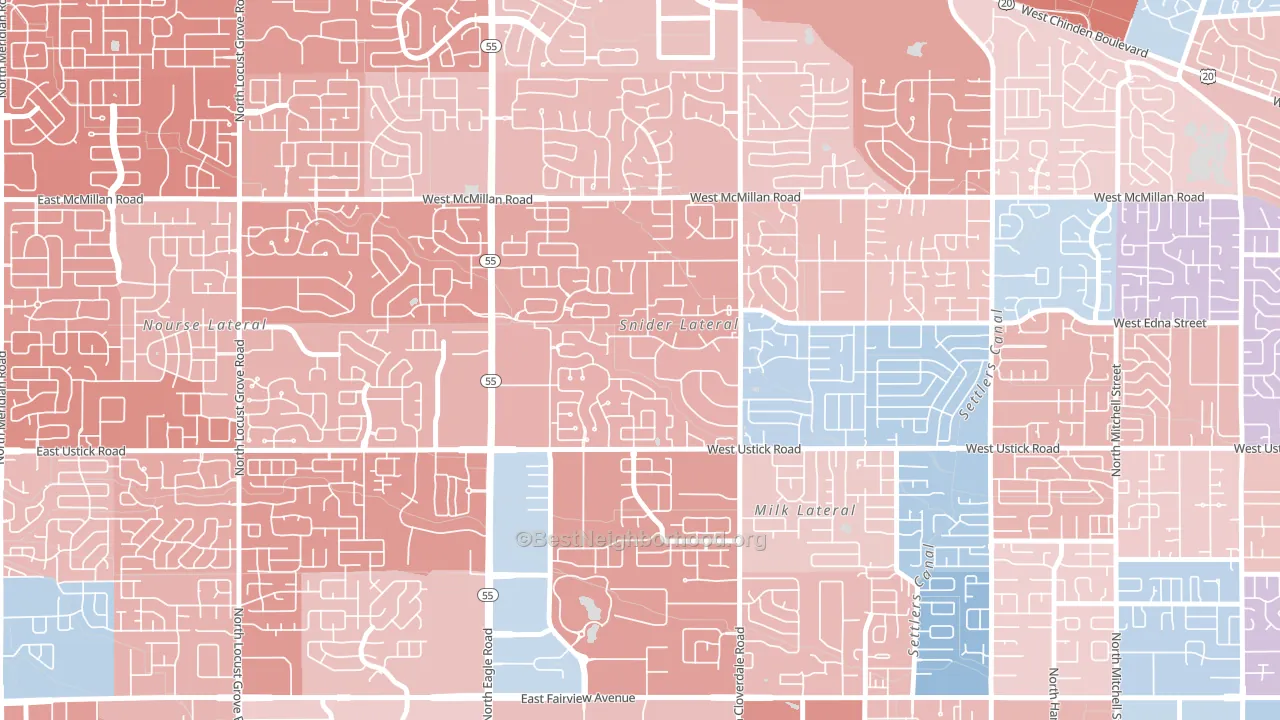
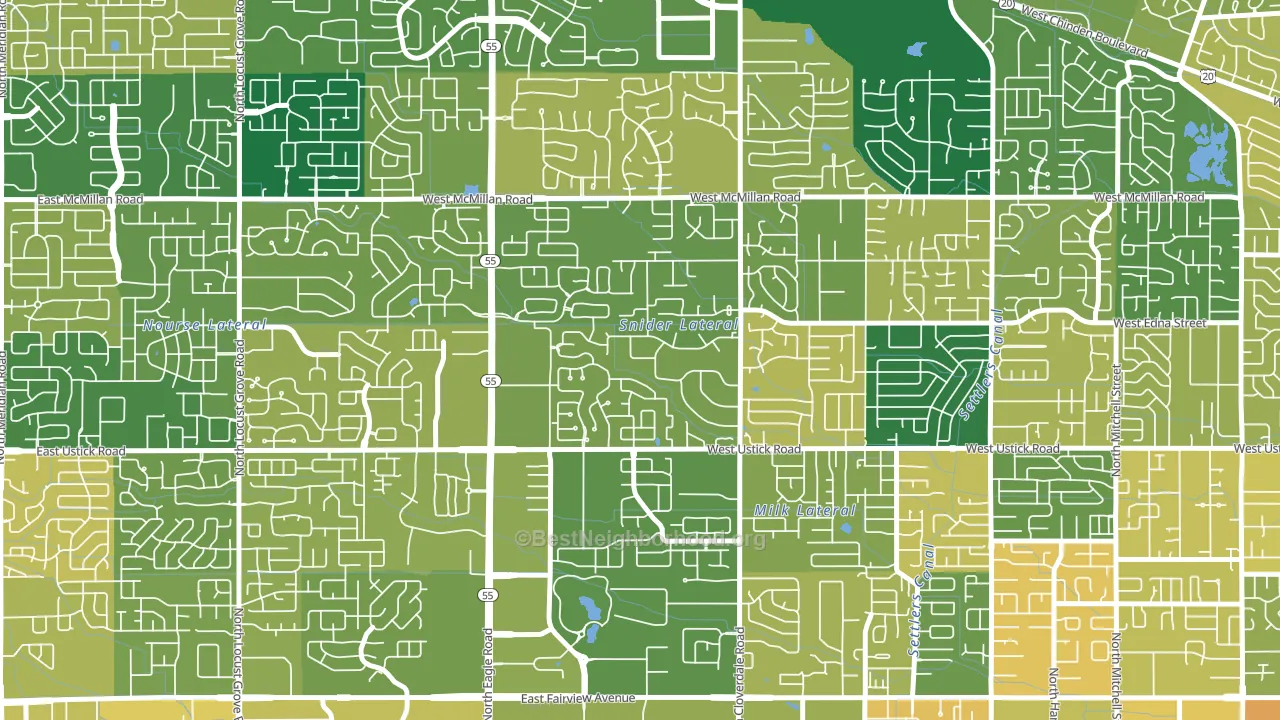
About 79% of adults in West Cloverdale typically vote, above the U.S. average of about 62%. Among adults in West Cloverdale, ~34% vote Democratic, ~45% Republican, and ~21% don't vote. The map below shows estimated turnout by block group.
How West Cloverdale compares
Among neighborhoods within 5 miles, West Cloverdale is the most Republican-leaning.
West Cloverdale runs about 23 points more Democratic than Idaho as a whole.
Why West Cloverdale leans the way it does
This analysis examined 14,881 data points per neighborhood to find what predicts political lean and turnout. The items below are a few correlations that stood out for West Cloverdale, not a ranked or complete list of what matters most.
Areas with many family households vote Republican. About 82% of households in West Cloverdale are family households, about 16 points above the U.S. average of 67%. Dense places usually vote Democratic, but West Cloverdale runs against that pattern.
Food insecurity and voter turnout
Places with low food insecurity tend to turn out at a higher rate; West Cloverdale, Boise, ID sits in the bottom quarter nationally on this measure. Food insecurity does not directly drive turnout; it reflects economic hardship, which lines up with lower voting.
Why turnout in West Cloverdale looks the way it does
Areas with strong routine healthcare access turn out at higher rates. West Cloverdale is in the top quarter nationally for routine-care measures such as insurance coverage, preventive screenings, and dental visits. The dental-visit rate here is about 72%, about 12 points above the U.S. average of 60%. Learn more about the findings and methodology on the political spectrum map.
Nearby Neighborhoods
- West Valley, Boise, ID Even
- West Bench, Boise, ID D+4
- Northwest, Garden City, ID Even
- Winstead Park, Boise, ID D+20
- Collister, Boise, ID D+21
- Franklin Randolph, Boise, ID Even
- Veterans Park, Boise, ID D+29
- Southwest Ada, Boise, ID R+21
- Sunset, Boise, ID D+44
- Central Bench, Boise, ID D+21
Neighborhoods with Similar Populations
- Woodville, North Lauderdale, FL D+51
- Downtown North Lauderdale, North Lauderdale, FL D+51
- Ghost Town, Laredo, TX D+8
- Downtown Chapel Hill, Chapel Hill, NC D+68
- Denver International Airport, Denver, CO D+45
- Orchidlands Estates, Keaau, HI D+6
- Blanco Gardens, San Marcos, TX D+24
- South Ruffner, Charleston, WV D+24
- Pheasant Hill, Dayton, OH D+3
- Hibiscus, Azalea Park, FL D+10
Sources and methodology
Precinct-level voting records used to fit the model come from Idaho Secretary of State, Elections, distributed by the Voting and Election Science Team. Demographic inputs come from the U.S. Census Bureau (ACS 5-year estimates and the 2020 Decennial Census). Health and environmental inputs come from the CDC (PLACES and the Environmental Justice Index). Land cover comes from the USGS and EPA. Election-day and lead-up weather come from PRISM 4km daily grids and the NOAA Global Historical Climatology Network. Mail-voting and election-administration patterns come from the MIT Election Lab's Survey of the Performance of American Elections. Block-group crime detail comes from CrimeGrade. Internet data and modeling support provided by ISPreports.org.
Modeling and analysis by the BestNeighborhood data science team. Full methodology and findings: political spectrum map.
Methodology reviewed by the BestNeighborhood data team. Last updated May 2026.