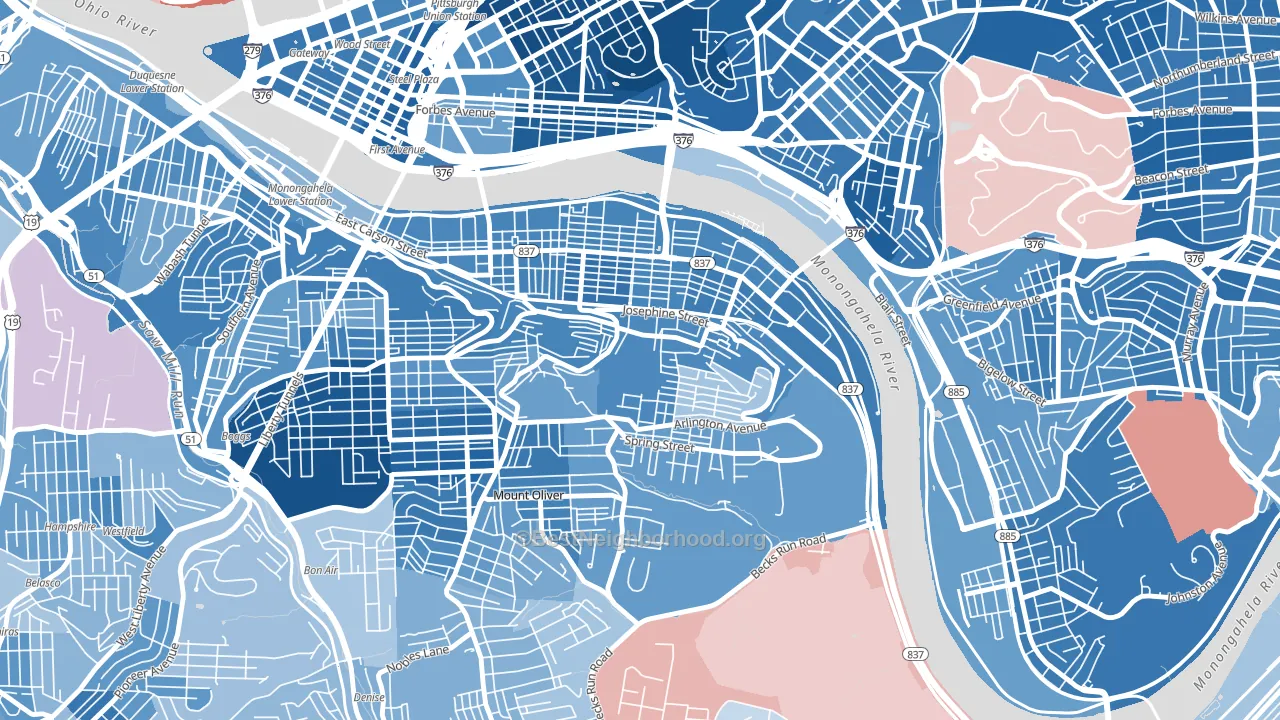
Southside Slopes leans heavily Democratic by roughly 42 points: about 71% of voters vote Democratic and 29% Republican.
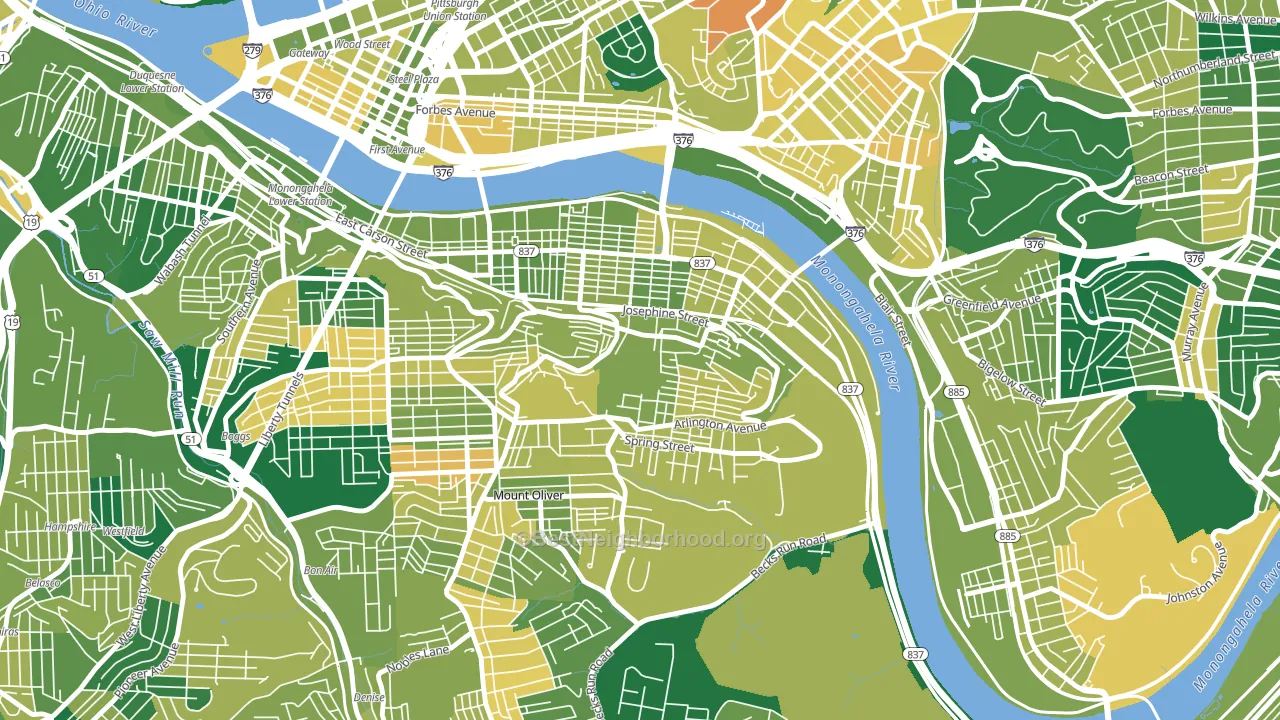
About 69% of adults in Southside Slopes typically vote, above the U.S. average of about 62%. Among adults in Southside Slopes, ~49% vote Democratic, ~20% Republican, and ~31% don't vote. The map below shows estimated turnout by block group.
How Southside Slopes compares
Among neighborhoods within 5 miles, Southside Slopes leans more Democratic than 12 of 38 neighbors.
Southside Slopes runs about 44 points more Democratic than Pennsylvania as a whole. Pennsylvania is roughly evenly split, and Southside Slopes sits clearly on the Democratic side.
Politics vary noticeably by block within Southside Slopes. The southwest side is the most Democratic-leaning (D+47) and the southeast side is the least Democratic-leaning (D+27), a spread of about 20 points.
Why Southside Slopes leans the way it does
This analysis examined 14,881 data points per neighborhood to find what predicts political lean and turnout. The items below are a few correlations that stood out for Southside Slopes, not a ranked or complete list of what matters most.
Southside Slopes votes against the grain of Pennsylvania. Pennsylvania is roughly evenly split, while Southside Slopes runs about 44 points more Democratic. A high never-married share predicts Democratic voting, and about 55% of adults in Southside Slopes have never been married, above 88% of neighborhoods.
Population density and Democratic lean
Places with high population density tend to lean Democratic; Southside Slopes, Pittsburgh, PA sits above the national average on this measure.
Why turnout in Southside Slopes looks the way it does
Turnout in Southside Slopes sits close to the national pattern. Routine healthcare access, homeownership, education, and food security all land near their national averages here. Learn more about the findings and methodology on the political spectrum map.
Nearby Neighborhoods
- Southside Flats, Pittsburgh, PA D+55
- Knoxville, Pittsburgh, PA D+59
- Bluff, Pittsburgh, PA D+48
- West Oakland, Pittsburgh, PA D+69
- Oakland, Pittsburgh, PA D+58
- Central Business District, Pittsburgh, PA D+55
- Mount Washington, Pittsburgh, PA D+40
- Hazelwood, Pittsburgh, PA D+50
- Greenfield, Pittsburgh, PA D+50
- North Oakland, Pittsburgh, PA D+65
Neighborhoods with Similar Populations
- Read Blvd West, New Orleans, LA D+87
- Lincoln Park, Yonkers, NY D+6
- Providence, Scranton, PA D+10
- East Petaluma, Petaluma, CA D+58
- Gert Town, New Orleans, LA D+79
- Cypress, Oxnard, CA D+29
- Bunker Hill, Pottsville, PA R+13
- Wake Forest University, Winston-Salem, NC D+46
- Sunset, Fort Lauderdale, FL D+14
- Oak Park, Jeffersonville, IN R+10
Sources and methodology
Precinct-level voting records used to fit the model come from Pennsylvania Department of State, Bureau of Elections, distributed by the Voting and Election Science Team. Demographic inputs come from the U.S. Census Bureau (ACS 5-year estimates and the 2020 Decennial Census). Health and environmental inputs come from the CDC (PLACES and the Environmental Justice Index). Land cover comes from the USGS and EPA. Election-day and lead-up weather come from PRISM 4km daily grids and the NOAA Global Historical Climatology Network. Mail-voting and election-administration patterns come from the MIT Election Lab's Survey of the Performance of American Elections. Block-group crime detail comes from CrimeGrade. Internet data and modeling support provided by ISPreports.org.
Modeling and analysis by the BestNeighborhood data science team. Full methodology and findings: political spectrum map.
Methodology reviewed by the BestNeighborhood data team. Last updated May 2026.