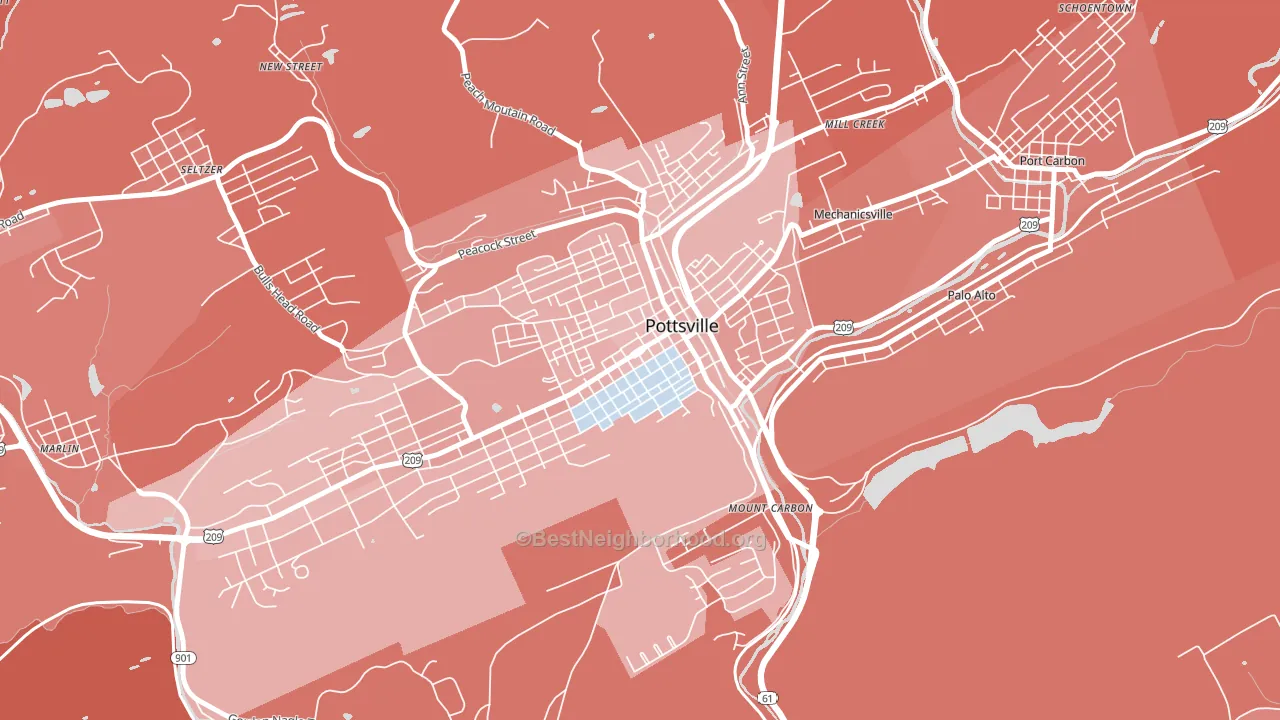
Bunker Hill leans slightly Republican by roughly 12 points: about 44% of voters vote Democratic and 56% Republican.
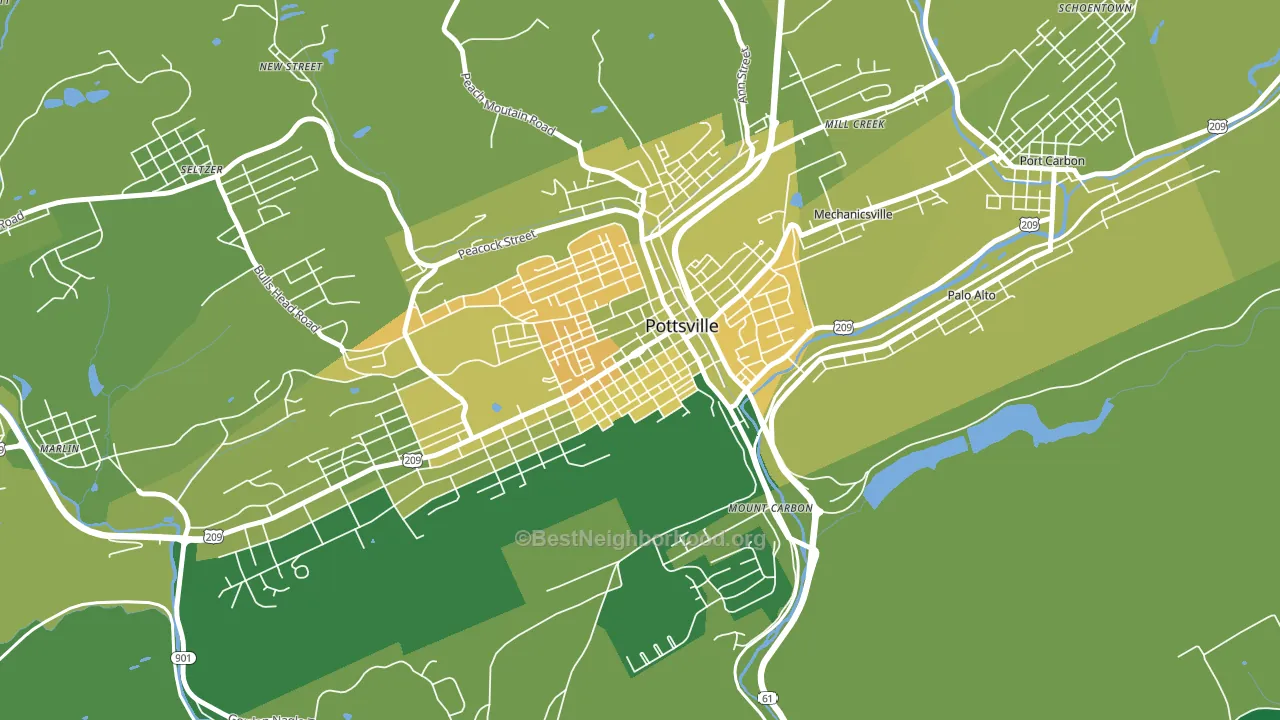
About 55% of adults in Bunker Hill typically vote, below the U.S. average of about 62%. Among adults in Bunker Hill, ~24% vote Democratic, ~31% Republican, and ~45% don't vote. The map below shows estimated turnout by block group.
How Bunker Hill compares
Bunker Hill runs about 11 points more Republican than Pennsylvania as a whole.
Politics vary noticeably by block within Bunker Hill. The northeast side is the most Republican-leaning (R+24) and the southeast side is the least Republican-leaning (R+7), a spread of about 17 points.
Why Bunker Hill leans the way it does
This analysis examined 14,881 data points per neighborhood to find what predicts political lean and turnout. The items below are a few correlations that stood out for Bunker Hill, not a ranked or complete list of what matters most.
Areas with a high white share and below-average college attainment vote Republican. In Bunker Hill, about 86% of residents are non-Hispanic white, about 13 points above the U.S. average of 72%; about 18% of adults hold a bachelor's degree, about 7 points below the Pennsylvania average of 26%.
Park access and Republican lean
Places with low park coverage tend to lean Republican; Bunker Hill, Pottsville, PA sits in the bottom tenth nationally on this measure. Park access does not change how people vote; it tends to track denser, higher-income areas.
Why turnout in Bunker Hill looks the way it does
Areas with limited routine healthcare access turn out at lower rates. Bunker Hill is in the bottom quarter nationally for routine-care measures such as insurance coverage, preventive screenings, and dental visits. Low high-school completion lines up with lower turnout, and about 85% of adults in Bunker Hill have completed high school, below 76% of neighborhoods. Learn more about the findings and methodology on the political spectrum map.
Nearby Neighborhoods
- Yorkville, Pottsville, PA R+18
- Dogtown, Selinsgrove, PA R+2
- West End Theatre District, Allentown, PA D+26
- West Park, Allentown, PA D+29
- West Walnut, Allentown, PA D+30
- Eighth Ward, Allentown, PA D+26
- Old Allentown, Allentown, PA D+34
- NoTi, Allentown, PA D+30
- Downtown, Allentown, PA D+38
- Jordan Heights, Allentown, PA D+36
Neighborhoods with Similar Populations
- Wake Forest University, Winston-Salem, NC D+46
- Oak Park, Jeffersonville, IN R+10
- Lincoln Park, Yonkers, NY D+6
- Southside, Nashville, TN D+74
- Southside Slopes, Pittsburgh, PA D+42
- Read Blvd West, New Orleans, LA D+87
- Providence, Scranton, PA D+10
- Pines Village, New Orleans, LA D+87
- East Petaluma, Petaluma, CA D+58
- Ken Caryl Ranch Plains, Ken Caryl, CO D+11
Sources and methodology
Precinct-level voting records used to fit the model come from Pennsylvania Department of State, Bureau of Elections, distributed by the Voting and Election Science Team. Demographic inputs come from the U.S. Census Bureau (ACS 5-year estimates and the 2020 Decennial Census). Health and environmental inputs come from the CDC (PLACES and the Environmental Justice Index). Land cover comes from the USGS and EPA. Election-day and lead-up weather come from PRISM 4km daily grids and the NOAA Global Historical Climatology Network. Mail-voting and election-administration patterns come from the MIT Election Lab's Survey of the Performance of American Elections. Block-group crime detail comes from CrimeGrade. Internet data and modeling support provided by ISPreports.org.
Modeling and analysis by the BestNeighborhood data science team. Full methodology and findings: political spectrum map.
Methodology reviewed by the BestNeighborhood data team. Last updated May 2026.