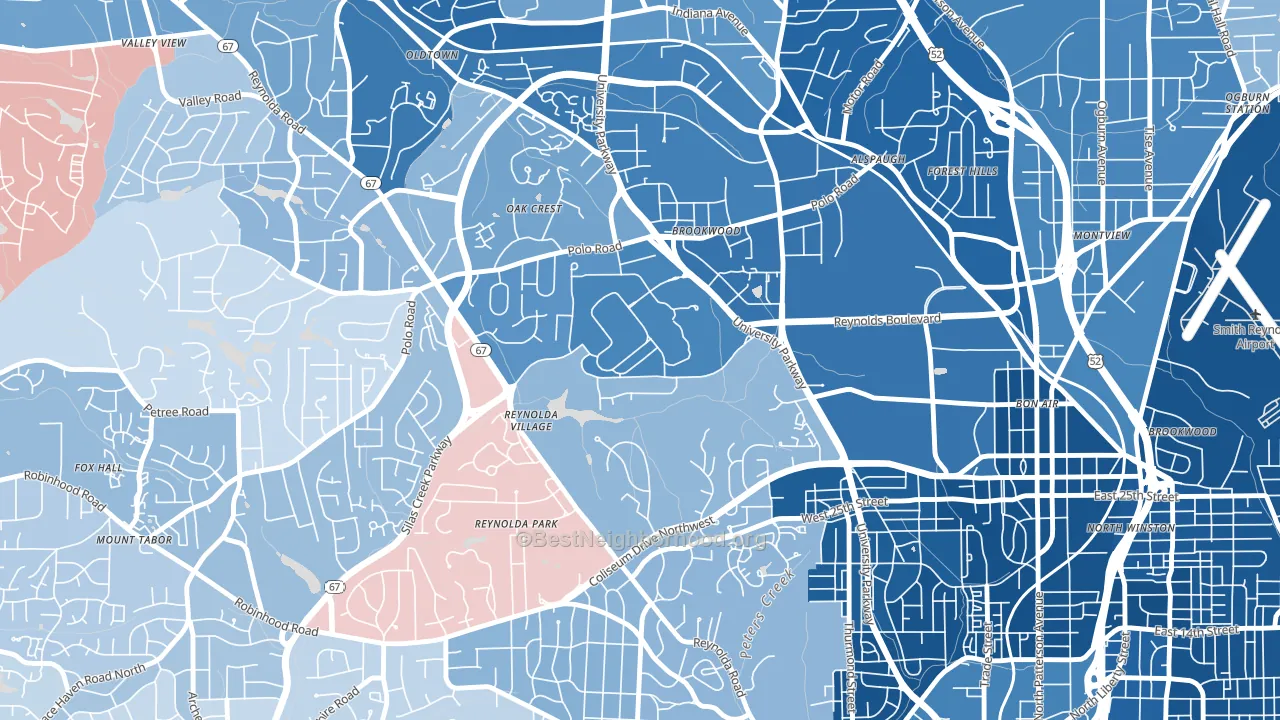
Wake Forest University leans heavily Democratic by roughly 46 points: about 73% of voters vote Democratic and 27% Republican.
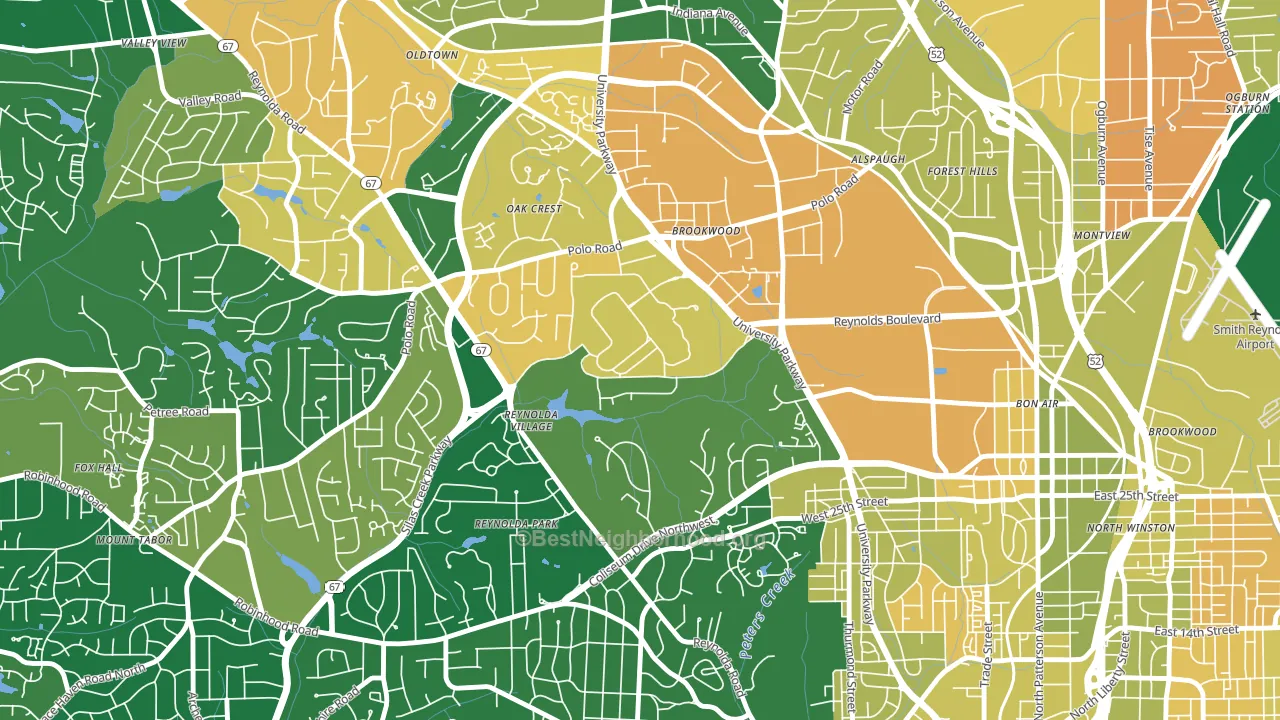
About 59% of adults in Wake Forest University typically vote, near the U.S. average of about 62%. Among adults in Wake Forest University, ~43% vote Democratic, ~16% Republican, and ~41% don't vote. The map below shows estimated turnout by block group.
How Wake Forest University compares
Wake Forest University sits in a sparsely populated area with few comparable neighborhoods nearby.
Wake Forest University runs about 49 points more Democratic than North Carolina as a whole. North Carolina leans Republican overall, while Wake Forest University is one of the few Democratic-leaning pockets.
Politics vary noticeably by block within Wake Forest University. The northeast side is the most Democratic-leaning (D+60) and the southwest side is the least Democratic-leaning (D+31), a spread of about 29 points.
Why Wake Forest University leans the way it does
This analysis examined 14,881 data points per neighborhood to find what predicts political lean and turnout. The items below are a few correlations that stood out for Wake Forest University, not a ranked or complete list of what matters most.
Areas with high college attainment vote Democratic. About 71% of adults in Wake Forest University hold a bachelor's degree, about 42 points above the U.S. average of 28%. A high never-married share predicts Democratic voting, and about 85% of adults in Wake Forest University have never been married, in the top fraction of neighborhoods. Wake Forest University runs against the grain of North Carolina, a Democratic-leaning pocket in a Republican-leaning state.
Population density and Democratic lean
Places with high population density tend to lean Democratic; Wake Forest University, Winston-Salem, NC sits above the national average on this measure.
Why turnout in Wake Forest University looks the way it does
Areas with low high-school completion turn out at lower rates. More than 99% of adults in Wake Forest University have completed high school, about 10 points above the U.S. average of 90%. High-crime urban areas turn out at lower rates, and Wake Forest University sits in the top 15% on a violent-crime measure. Learn more about the findings and methodology on the political spectrum map.
Nearby Neighborhoods
- East Winston, Winston-Salem, NC D+82
- Ardmore, Winston-Salem, NC D+49
- Konnoak, Winston-Salem, NC D+38
- Downtown High Point, High Point, NC D+51
- Adams Farm, Greensboro, NC D+41
- Hewitt Area, Greensboro, NC D+60
- Starmount Forest, Greensboro, NC D+39
- Lindley Park, Greensboro, NC D+52
- Brice Street Area, Greensboro, NC D+61
- Rolling Roads, Greensboro, NC D+51
Neighborhoods with Similar Populations
- Oak Park, Jeffersonville, IN R+10
- Bunker Hill, Pottsville, PA R+13
- Southside, Nashville, TN D+74
- Pines Village, New Orleans, LA D+87
- Lincoln Park, Yonkers, NY D+6
- Southside Slopes, Pittsburgh, PA D+42
- Ken Caryl Ranch Plains, Ken Caryl, CO D+11
- Providence, Scranton, PA D+10
- Read Blvd West, New Orleans, LA D+87
- East Petaluma, Petaluma, CA D+58
Sources and methodology
Precinct-level voting records used to fit the model come from North Carolina State Board of Elections, distributed by the Voting and Election Science Team. Demographic inputs come from the U.S. Census Bureau (ACS 5-year estimates and the 2020 Decennial Census). Health and environmental inputs come from the CDC (PLACES and the Environmental Justice Index). Land cover comes from the USGS and EPA. Election-day and lead-up weather come from PRISM 4km daily grids and the NOAA Global Historical Climatology Network. Mail-voting and election-administration patterns come from the MIT Election Lab's Survey of the Performance of American Elections. Block-group crime detail comes from CrimeGrade. Internet data and modeling support provided by ISPreports.org.
Modeling and analysis by the BestNeighborhood data science team. Full methodology and findings: political spectrum map.
Methodology reviewed by the BestNeighborhood data team. Last updated May 2026.