Eden Isle leans slightly Republican by roughly 6 points: about 47% of voters vote Democratic and 53% Republican.
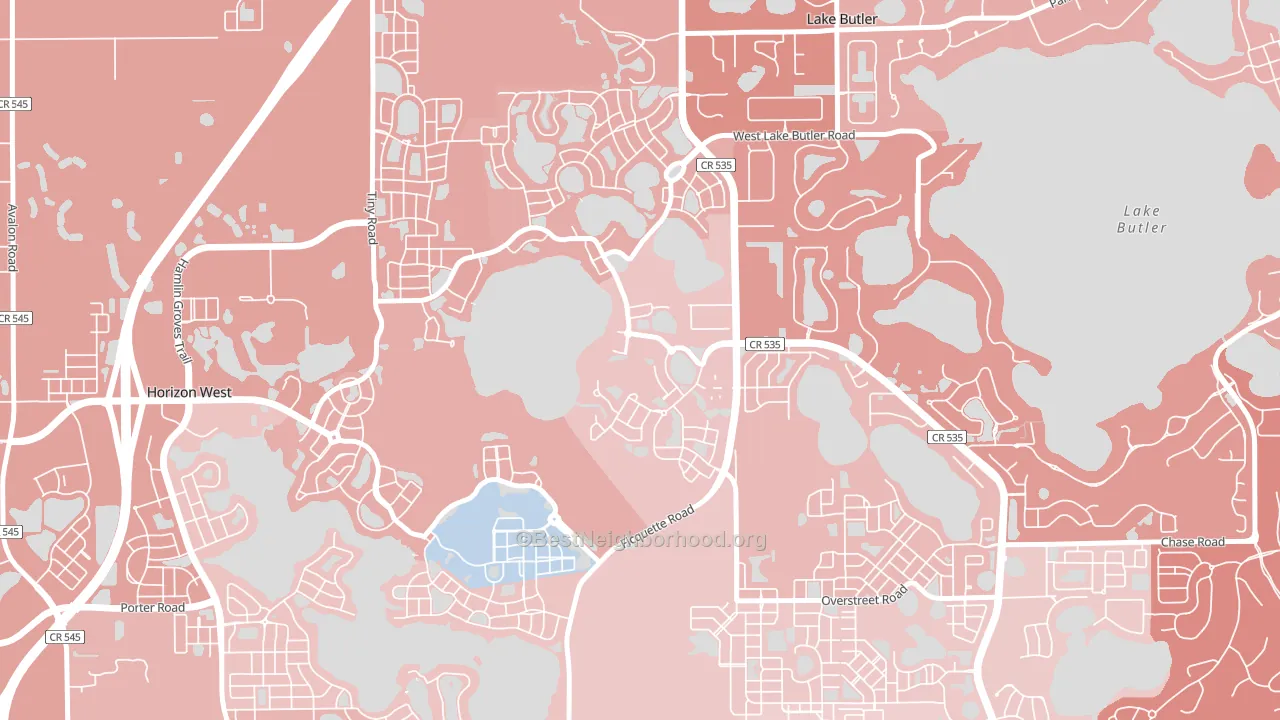
About 68% of adults in Eden Isle typically vote, above the U.S. average of about 62%. Among adults in Eden Isle, ~32% vote Democratic, ~36% Republican, and ~32% don't vote. The map below shows estimated turnout by block group.
How Eden Isle compares
Eden Isle sits in a sparsely populated area with few comparable neighborhoods nearby.
Eden Isle runs about 7 points more Democratic than Florida as a whole.
Why Eden Isle leans the way it does
This analysis examined 14,881 data points per neighborhood to find what predicts political lean and turnout. The items below are a few correlations that stood out for Eden Isle, not a ranked or complete list of what matters most.
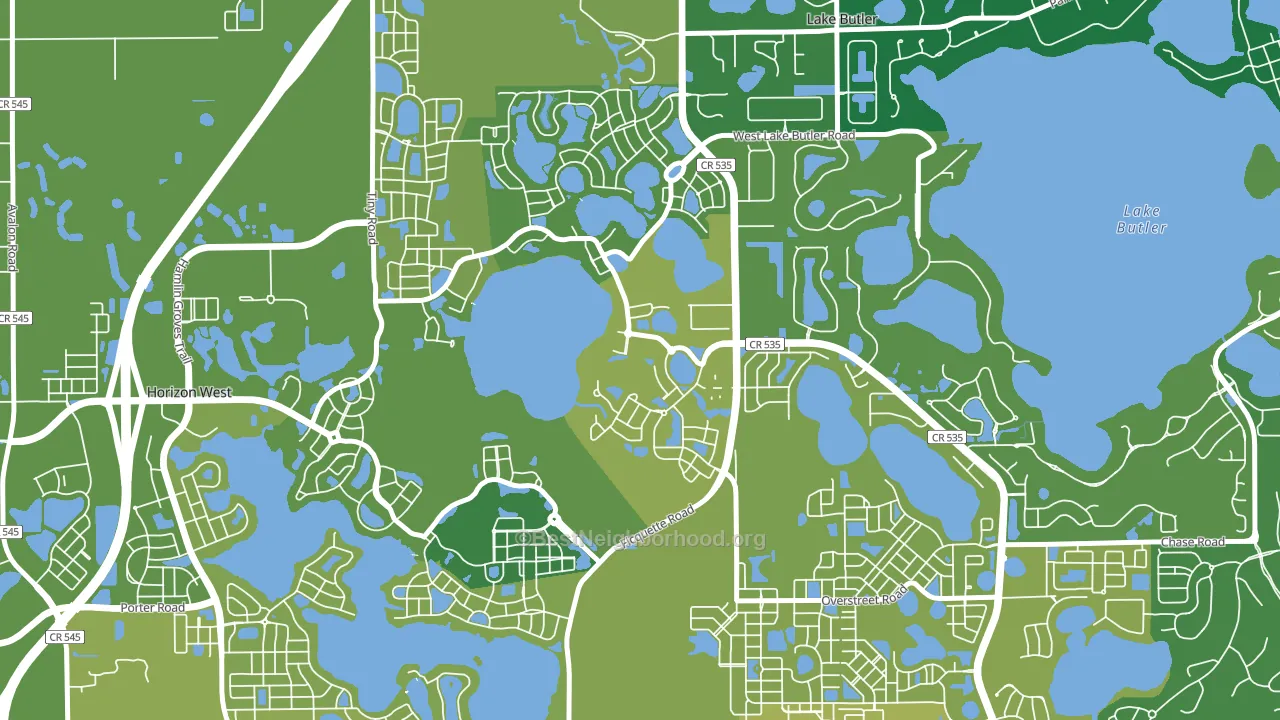
Rural areas vote Republican, and Eden Isle sits in the bottom quarter on developed land relative to similar places.
Paved land cover and Republican lean
Places with little paved surface tend to lean Republican; Eden Isle, Horizon West, FL sits in the bottom quarter nationally on this measure. Paved ground does not change how people vote; it mostly reflects how urban and built-up a place is.
Why turnout in Eden Isle looks the way it does
Turnout in Eden Isle sits close to the national pattern. Routine healthcare access, homeownership, education, and food security all land near their national averages here. Learn more about the findings and methodology on the political spectrum map.
Nearby Neighborhoods
- Signature Lakes, Horizon West, FL R+6
- Stoneybrook West, Winter Garden, FL Even
- Kirkman South, Orlando, FL D+8
- Metro West, Orlando, FL D+20
- Florida Center, Orlando, FL D+21
- Westland Terrace, Pine Hills, FL D+70
- Westwood, Orlando, FL D+15
- Kirkman North, Orlando, FL D+53
- Florida Center North, Orlando, FL D+24
- Lost Lake, Clermont, FL R+10
Neighborhoods with Similar Populations
- Glacier View, Everett, WA D+16
- El Paso Lower Valley, El Paso, TX D+26
- Westwood, Pittsburgh, PA D+20
- Medical District, Memphis, TN D+71
- Wortendyke, Midland Park, NJ R+2
- Crooked River Ranch, Terrebonne, OR R+43
- Landon Branch, Waco, TX R+16
- Sunny Slope, San Antonio, TX D+35
- College View, Starkville, MS D+4
- Olde Providence North, Charlotte, NC D+5
Sources and methodology
Precinct-level voting records used to fit the model come from Florida Division of Elections, distributed by the Voting and Election Science Team. Demographic inputs come from the U.S. Census Bureau (ACS 5-year estimates and the 2020 Decennial Census). Health and environmental inputs come from the CDC (PLACES and the Environmental Justice Index). Land cover comes from the USGS and EPA. Election-day and lead-up weather come from PRISM 4km daily grids and the NOAA Global Historical Climatology Network. Mail-voting and election-administration patterns come from the MIT Election Lab's Survey of the Performance of American Elections. Block-group crime detail comes from CrimeGrade. Internet data and modeling support provided by ISPreports.org.
Modeling and analysis by the BestNeighborhood data science team. Full methodology and findings: political spectrum map.
Methodology reviewed by the BestNeighborhood data team. Last updated May 2026.