Straits Corners leans heavily Republican by roughly 40 points: about 30% of voters vote Democratic and 70% Republican.
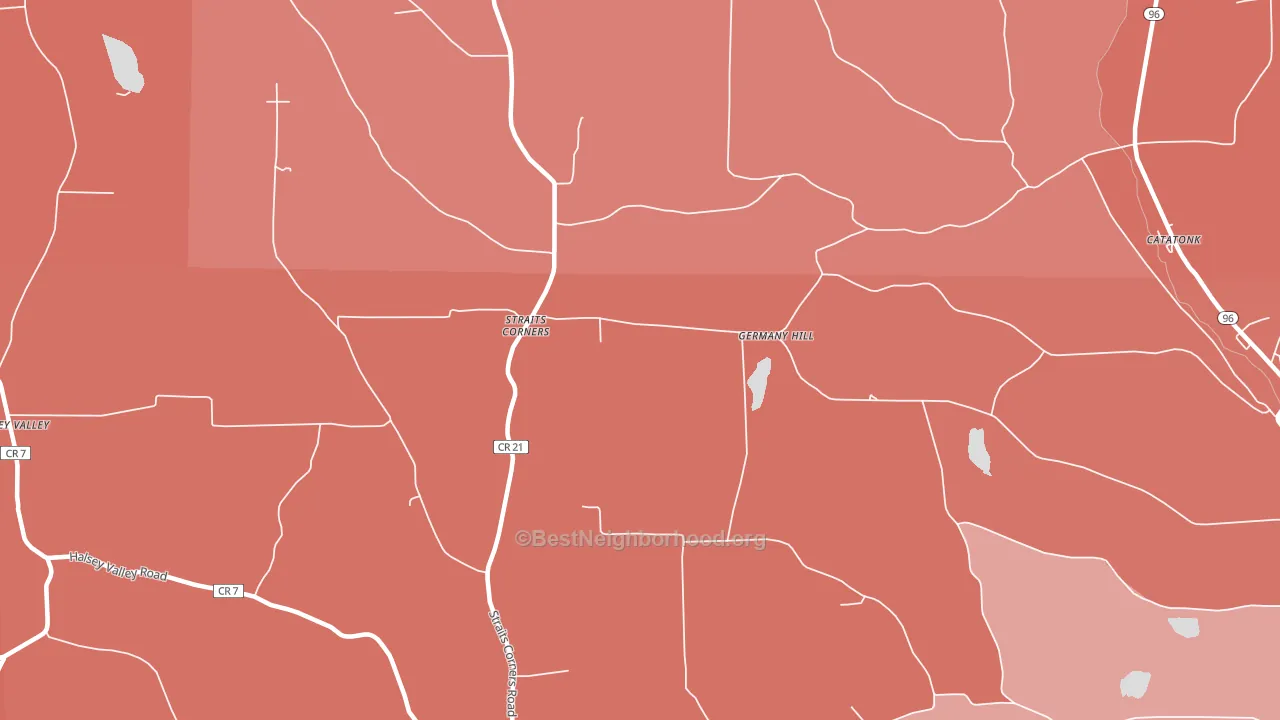
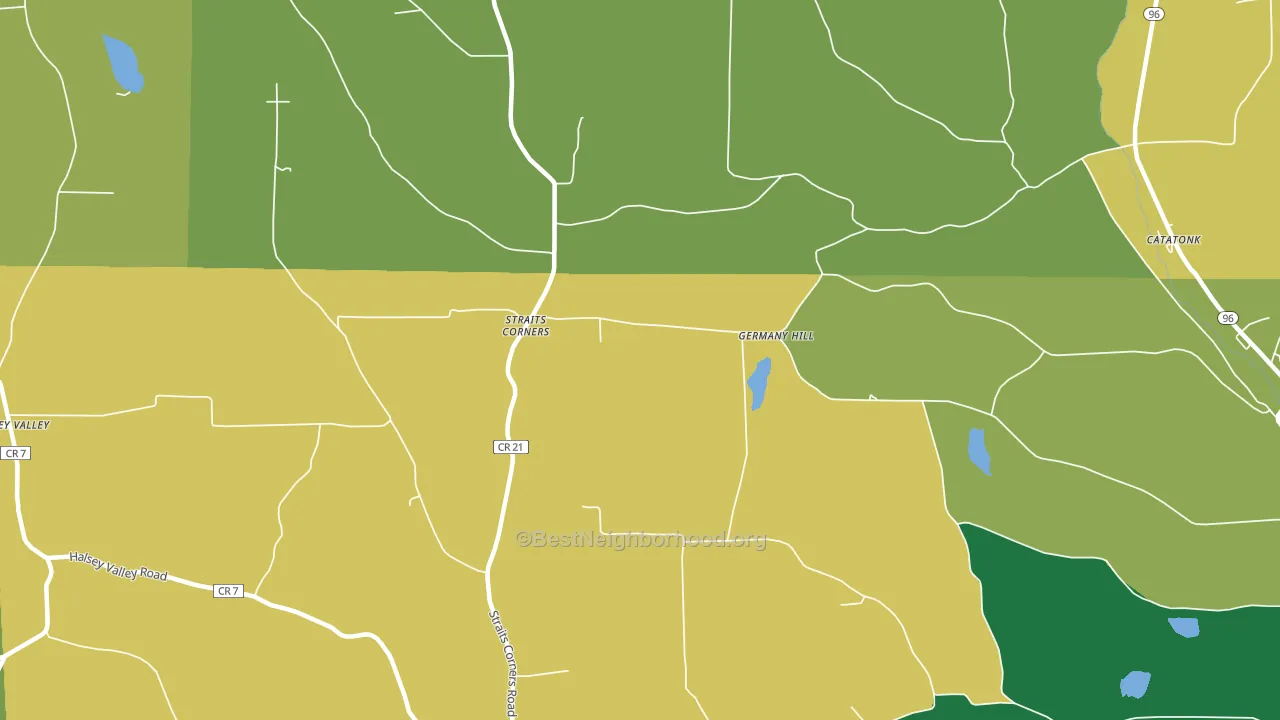
About 60% of adults in Straits Corners typically vote, near the U.S. average of about 62%. Among adults in Straits Corners, ~18% vote Democratic, ~42% Republican, and ~40% don't vote. The map below shows estimated turnout by block group.
How Straits Corners compares
Among cities within 25 miles, Straits Corners leans more Republican than 59 of 105 neighbors.
Straits Corners runs about 52 points more Republican than New York as a whole. New York leans Democratic overall, while Straits Corners is one of the few Republican-leaning pockets.
Why Straits Corners leans the way it does
This analysis examined 14,881 data points per city to find what predicts political lean and turnout. The items below are a few correlations that stood out for Straits Corners, not a ranked or complete list of what matters most.
Straits Corners votes against the grain of New York. New York leans Democratic overall, while Straits Corners runs about 52 points more Republican. Car-dependent areas vote Republican, and about 86% of residents in Straits Corners drive to work alone, above 84% of cities. Low college attainment predicts Republican voting, and Straits Corners sits in the bottom quarter (about 13%, below 83% of cities).
Homeownership and voter turnout
Places with renter-heavy households tend to turn out at a lower rate; Straits Corners, NY sits in the bottom quarter nationally on this measure.
Why turnout in Straits Corners looks the way it does
Renters vote less often than owners. About 32% of households in Straits Corners rent, about 7 points above the U.S. average of 25%. Strong routine healthcare access lines up with higher turnout, and Straits Corners sits in the top quarter on routine-care measures. Learn more about the findings and methodology on the political spectrum map.
Nearby Cities
- West Candor, NY R+34
- Candor, NY R+37
- Barton, NY R+43
- Lounsberry, NY R+41
- Owego, NY R+20
- Smithboro, NY R+42
- Glencairn, NY R+45
- Nichols, NY R+42
- Gaskill, NY R+21
- Spencer, NY R+22
Cities with Similar Populations
- Zimco, AL R+5
- Beetown, WI R+46
- Pratt, MN R+47
- Valley Fork, WV R+61
- Morning Star, AR R+72
- Willey, IA R+57
- North Pownal, VT D+5
- Maple View, NY R+36
- Mark, IA R+62
- San Gregorio, CA D+36
Sources and methodology
Precinct-level voting records used to fit the model come from New York State Board of Elections, distributed by the Voting and Election Science Team. Demographic inputs come from the U.S. Census Bureau (ACS 5-year estimates and the 2020 Decennial Census). Health and environmental inputs come from the CDC (PLACES and the Environmental Justice Index). Land cover comes from the USGS and EPA. Election-day and lead-up weather come from PRISM 4km daily grids and the NOAA Global Historical Climatology Network. Mail-voting and election-administration patterns come from the MIT Election Lab's Survey of the Performance of American Elections. Block-group crime detail comes from CrimeGrade. Internet data and modeling support provided by ISPreports.org.
Modeling and analysis by the BestNeighborhood data science team. Full methodology and findings: political spectrum map.
Methodology reviewed by the BestNeighborhood data team. Last updated May 2026.