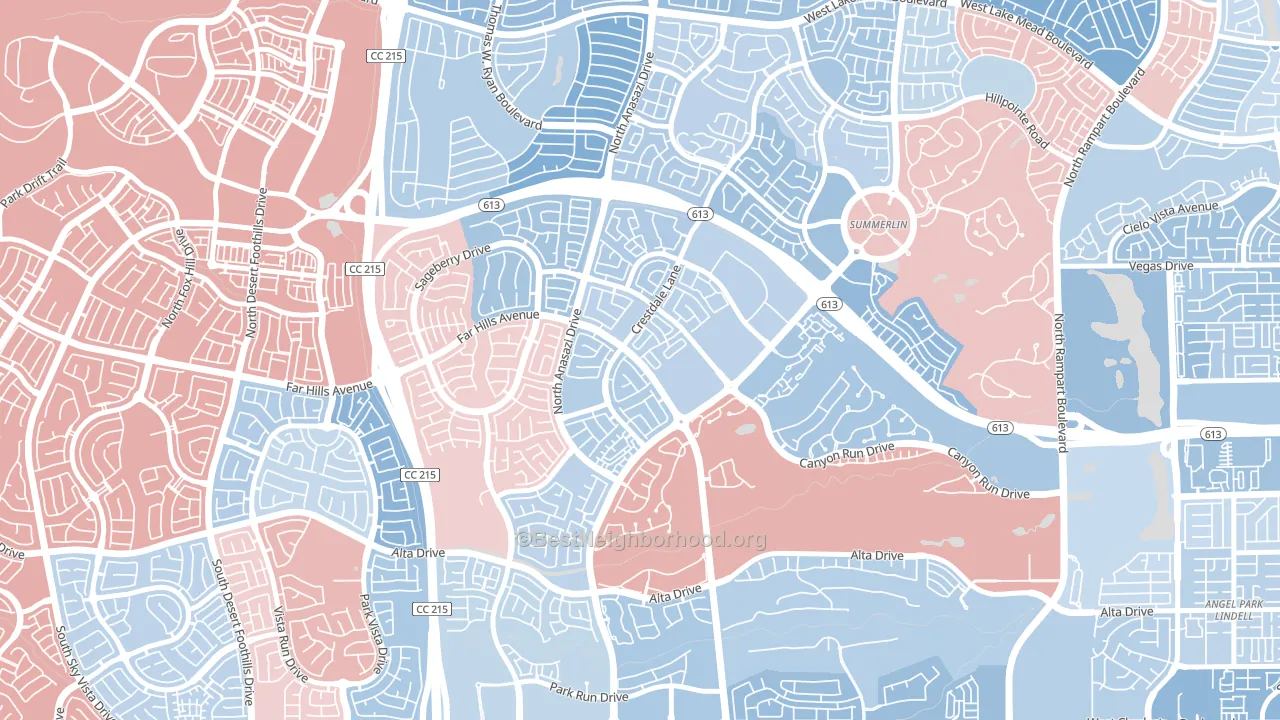
The Crossing leans slightly Democratic by roughly 6 points: about 53% of voters vote Democratic and 47% Republican.
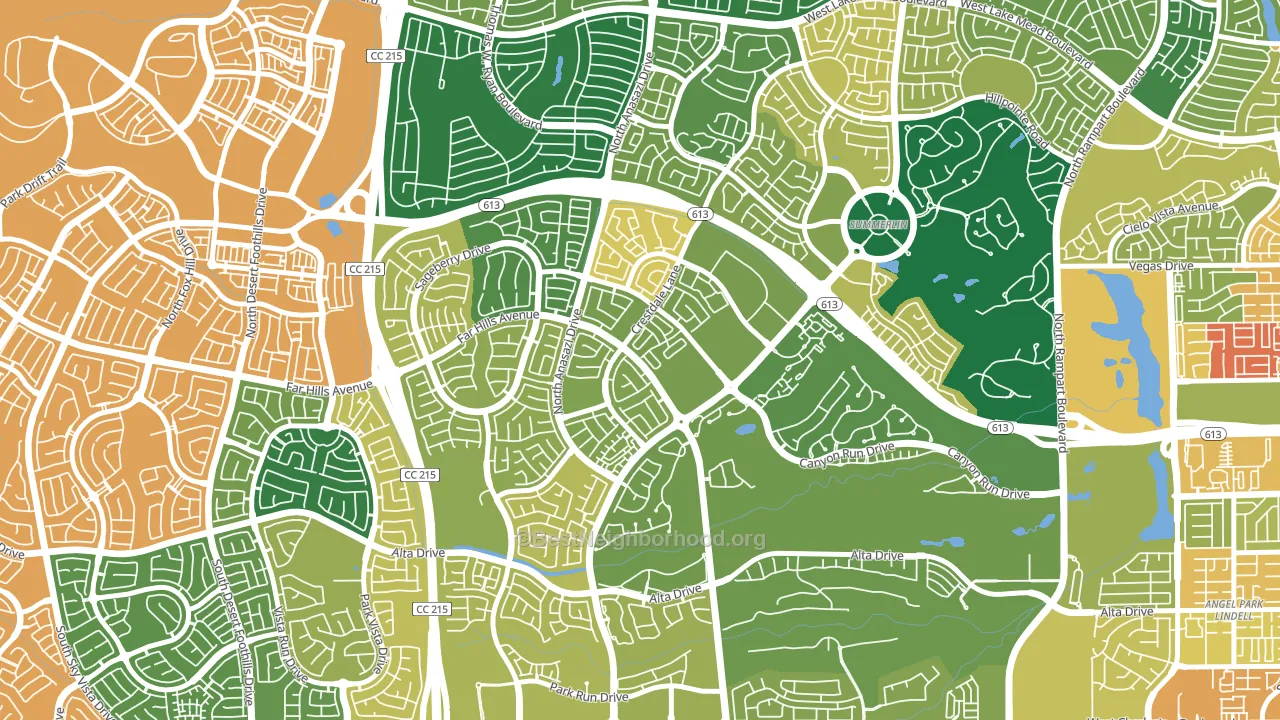
About 71% of adults in The Crossing typically vote, above the U.S. average of about 62%. Among adults in The Crossing, ~38% vote Democratic, ~33% Republican, and ~29% don't vote. The map below shows estimated turnout by block group.
How The Crossing compares
Among neighborhoods within 5 miles, The Crossing leans more Democratic than 4 of 13 neighbors.
The Crossing runs about 9 points more Democratic than Nevada as a whole.
Politics vary noticeably by block within The Crossing. The northwest side runs the most Democratic (D+11) and the southeast side runs the most Republican (R+4), a spread of about 15 points.
Why The Crossing leans the way it does
Density, race composition, education, and family structure all sit close to their national averages in The Crossing. The lean here lands roughly where demographic data alone would predict.
Population density, never-married share, and Democratic lean
Places that combine high population density and a low never-married share tend to lean Democratic, as The Crossing, Las Vegas, NV does.
Why turnout in The Crossing looks the way it does
Areas with high high-school completion turn out at higher rates. About 98% of adults in The Crossing have completed high school, about 9 points above the Nevada average of 89%. Learn more about the findings and methodology on the political spectrum map.
Nearby Neighborhoods
- Summerlin North, Las Vegas, NV D+5
- The Trails, Las Vegas, NV D+9
- The Vistas, Las Vegas, NV Even
- Sun City Summerlin, Las Vegas, NV D+8
- The Paseos, Las Vegas, NV R+4
- The Lakes, Las Vegas, NV D+9
- Angel Park Lindell, Las Vegas, NV D+11
- The Pueblo, Las Vegas, NV D+13
- Pioneer Park, Las Vegas, NV D+16
- Desert Shores, Las Vegas, NV D+22
Neighborhoods with Similar Populations
- Euclid-Green, Cleveland, OH D+87
- Downtown Jacksonville, Jacksonville, FL D+46
- Lemonwood Eastmont, Oxnard, CA D+35
- Fairgrounds, New Orleans, LA D+68
- East Dedham, Dedham, MA D+28
- Valencia, Buckeye, AZ R+14
- Center Bluff, Peoria, IL D+47
- Rancho San Antonio, Oakland, CA D+50
- Meadow Wood, Aurora, CO D+12
- Southwest Garden, St. Louis, MO D+53
Sources and methodology
Precinct-level voting records used to fit the model come from Nevada Secretary of State, Elections, distributed by the Voting and Election Science Team. Demographic inputs come from the U.S. Census Bureau (ACS 5-year estimates and the 2020 Decennial Census). Health and environmental inputs come from the CDC (PLACES and the Environmental Justice Index). Land cover comes from the USGS and EPA. Election-day and lead-up weather come from PRISM 4km daily grids and the NOAA Global Historical Climatology Network. Mail-voting and election-administration patterns come from the MIT Election Lab's Survey of the Performance of American Elections. Block-group crime detail comes from CrimeGrade. Internet data and modeling support provided by ISPreports.org.
Modeling and analysis by the BestNeighborhood data science team. Full methodology and findings: political spectrum map.
Methodology reviewed by the BestNeighborhood data team. Last updated May 2026.