Tower Triangle leans slightly Democratic by roughly 10 points: about 55% of voters vote Democratic and 45% Republican.
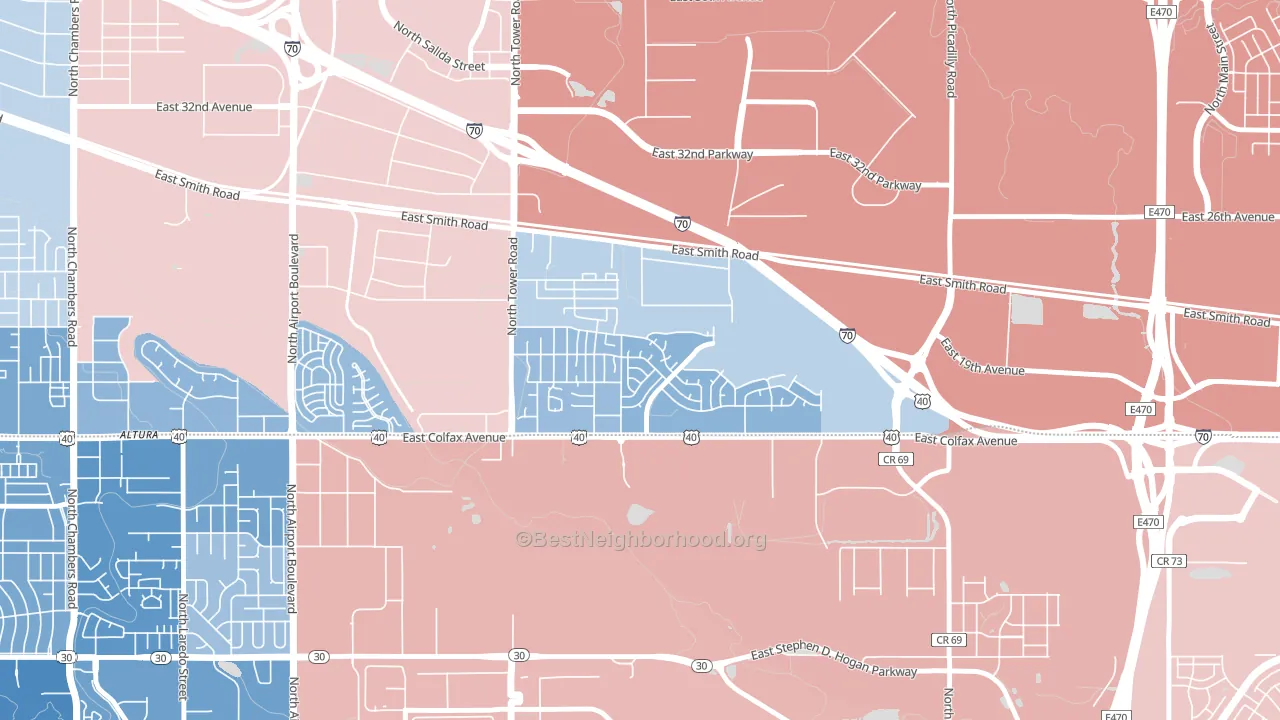
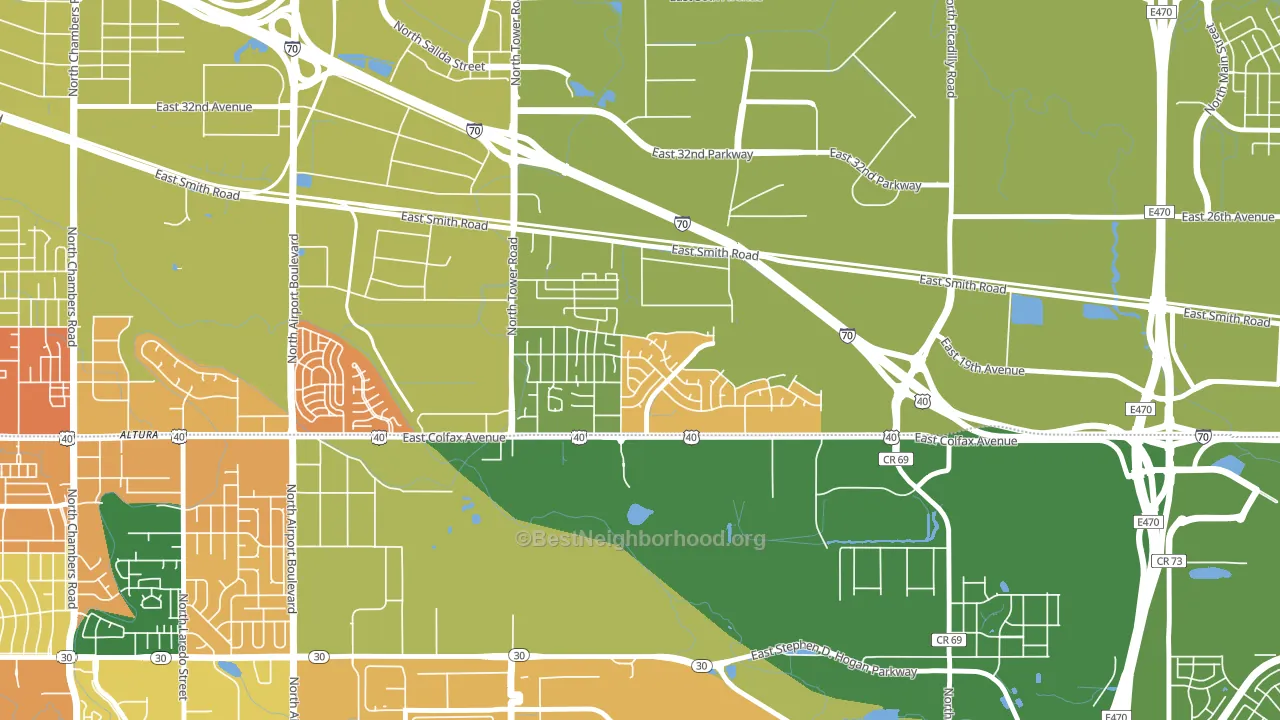
About 58% of adults in Tower Triangle typically vote, near the U.S. average of about 62%. Among adults in Tower Triangle, ~32% vote Democratic, ~26% Republican, and ~42% don't vote. The map below shows estimated turnout by block group.
How Tower Triangle compares
Among neighborhoods within 5 miles, Tower Triangle leans more Democratic than 1 of 21 neighbors.
Politically, Tower Triangle sits close to the rest of Colorado.
Why Tower Triangle leans the way it does
Density, race composition, education, and family structure all sit close to their national averages in Tower Triangle. The lean here lands roughly where demographic data alone would predict.
High-school completion, uninsured rate, and voter turnout
Places that combine low high-school-completion share and a high uninsured rate tend to turn out at a lower rate, as Tower Triangle, Aurora, CO does.
Why turnout in Tower Triangle looks the way it does
Areas with limited routine healthcare access turn out at lower rates. Tower Triangle is in the bottom quarter nationally for routine-care measures such as insurance coverage, preventive screenings, and dental visits. Learn more about the findings and methodology on the political spectrum map.
Nearby Neighborhoods
- Laredo Highline, Aurora, CO D+28
- Gateway-Green Valley Ranch, Denver, CO D+40
- Centretech, Aurora, CO D+34
- Sable Altura Chambers, Aurora, CO D+24
- Chambers Heights, Aurora, CO D+28
- Tollgate Overlook, Aurora, CO D+36
- City Center North, Aurora, CO D+45
- Center Pointe, Aurora, CO D+34
- Jewell Heights-Hoffman Heights, Aurora, CO D+37
- Side Creek, Aurora, CO D+23
Neighborhoods with Similar Populations
- Palo Verde, Tucson, AZ D+41
- Northeast, Tampa, FL D+68
- Strawberry Hill, Kansas City, KS D+43
- South Rose Hill, Kirkland, WA D+44
- East End, Portland, ME D+76
- Ballentine Place, Norfolk, VA D+68
- Millsmont, Oakland, CA D+84
- Estudillo Estates-Glen, San Leandro, CA D+54
- Arden, Martinsburg, WV R+50
- Wright View, Dayton, OH Even
Sources and methodology
Precinct-level voting records used to fit the model come from Colorado Secretary of State, Elections, distributed by the Voting and Election Science Team. Demographic inputs come from the U.S. Census Bureau (ACS 5-year estimates and the 2020 Decennial Census). Health and environmental inputs come from the CDC (PLACES and the Environmental Justice Index). Land cover comes from the USGS and EPA. Election-day and lead-up weather come from PRISM 4km daily grids and the NOAA Global Historical Climatology Network. Mail-voting and election-administration patterns come from the MIT Election Lab's Survey of the Performance of American Elections. Block-group crime detail comes from CrimeGrade. Internet data and modeling support provided by ISPreports.org.
Modeling and analysis by the BestNeighborhood data science team. Full methodology and findings: political spectrum map.
Methodology reviewed by the BestNeighborhood data team. Last updated May 2026.