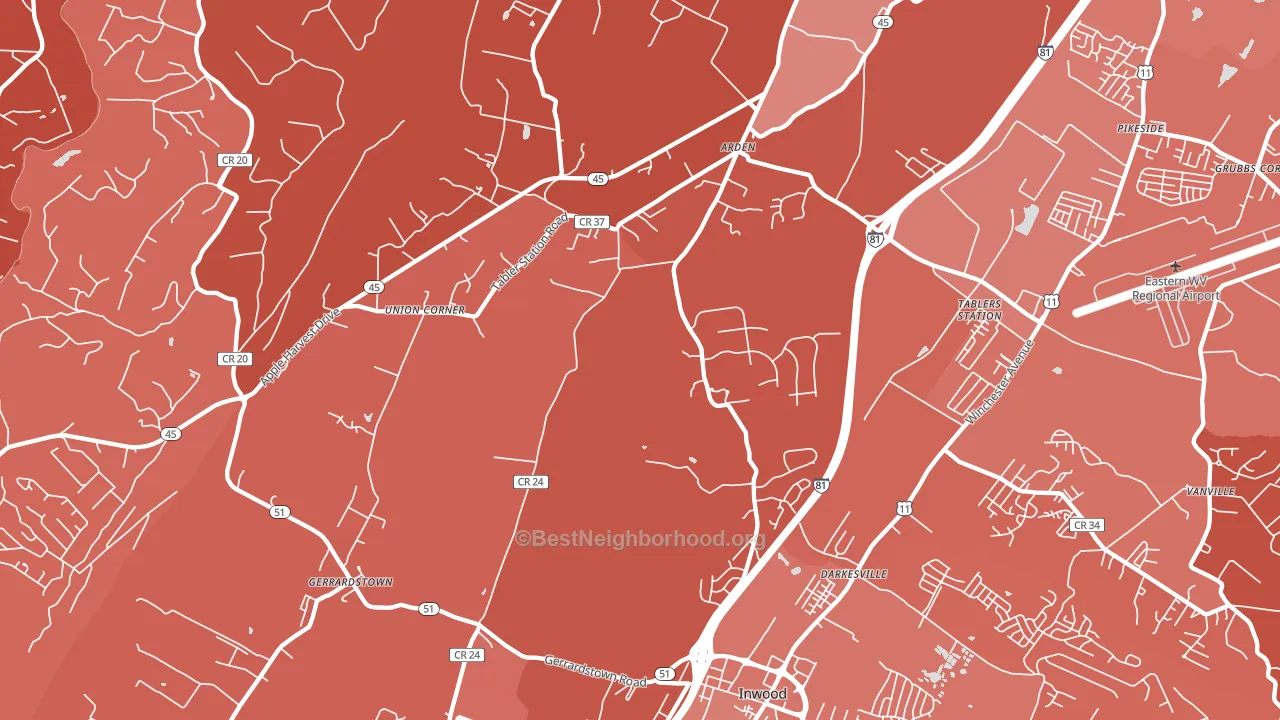
Arden leans heavily Republican by roughly 50 points: about 25% of voters vote Democratic and 75% Republican.
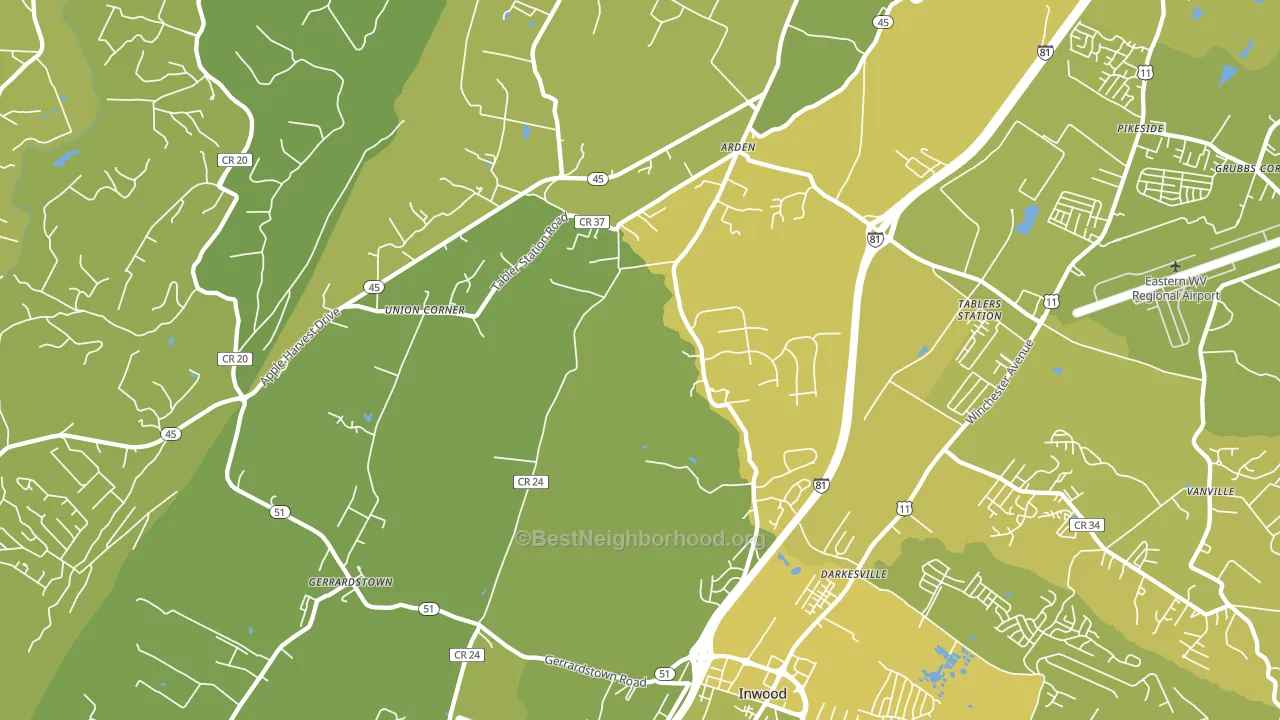
About 66% of adults in Arden typically vote, near the U.S. average of about 62%. Among adults in Arden, ~17% vote Democratic, ~49% Republican, and ~34% don't vote. The map below shows estimated turnout by block group.
How Arden compares
Arden sits in a sparsely populated area with few comparable neighborhoods nearby.
Arden runs about 8 points more Republican than West Virginia as a whole.
Politics vary noticeably by block within Arden. The northwest side is the most Republican-leaning (R+62) and the northeast side is the least Republican-leaning (R+34), a spread of about 28 points.
Why Arden leans the way it does
This analysis examined 14,881 data points per neighborhood to find what predicts political lean and turnout. The items below are a few correlations that stood out for Arden, not a ranked or complete list of what matters most.
Areas with a high white share and below-average college attainment vote Republican. In Arden, about 85% of residents are non-Hispanic white, about 13 points above the U.S. average of 72%; about 20% of adults hold a bachelor's degree, about 8 points below the U.S. average of 28%. Rural areas vote Republican, and Arden sits in the bottom quarter on density (about 20%, below 96% of neighborhoods).
Walkability and Republican lean
Places with a low walkability score tend to lean Republican; Arden, Martinsburg, WV sits in the bottom tenth nationally on this measure. A walkable street grid does not change how people vote; it mostly reflects how urban a place is.
Why turnout in Arden looks the way it does
Homeowners vote more often than renters. About 86% of households in Arden own their home, about 11 points above the U.S. average of 75%. Learn more about the findings and methodology on the political spectrum map.
Nearby Neighborhoods
- Darkesville, Inwood, WV R+35
- Tarico Heights, Inwood, WV R+39
- Nollville, Martinsburg, WV R+26
- Berkeley Place, Martinsburg, WV R+4
- Rosemont, Martinsburg, WV R+6
- Berkeley, Martinsburg, WV R+23
- Hainesville, Martinsburg, WV R+29
- Downtown Frederick, Frederick, MD D+56
- Ashburn Farm, Ashburn, VA D+23
- Ashburn Village, Ashburn, VA D+26
Neighborhoods with Similar Populations
- South Post, Fort Belvoir, VA D+19
- Ballentine Place, Norfolk, VA D+68
- Estudillo Estates-Glen, San Leandro, CA D+54
- South Rose Hill, Kirkland, WA D+44
- Strawberry Hill, Kansas City, KS D+43
- Robinvale, Metuchen, NJ D+36
- Palo Verde, Tucson, AZ D+41
- Edgehill, Nashville, TN D+64
- Tower Triangle, Aurora, CO D+9
- Northeast, Tampa, FL D+68
Sources and methodology
Precinct-level voting records used to fit the model come from West Virginia Secretary of State, Elections, distributed by the Voting and Election Science Team. Demographic inputs come from the U.S. Census Bureau (ACS 5-year estimates and the 2020 Decennial Census). Health and environmental inputs come from the CDC (PLACES and the Environmental Justice Index). Land cover comes from the USGS and EPA. Election-day and lead-up weather come from PRISM 4km daily grids and the NOAA Global Historical Climatology Network. Mail-voting and election-administration patterns come from the MIT Election Lab's Survey of the Performance of American Elections. Block-group crime detail comes from CrimeGrade. Internet data and modeling support provided by ISPreports.org.
Modeling and analysis by the BestNeighborhood data science team. Full methodology and findings: political spectrum map.
Methodology reviewed by the BestNeighborhood data team. Last updated May 2026.