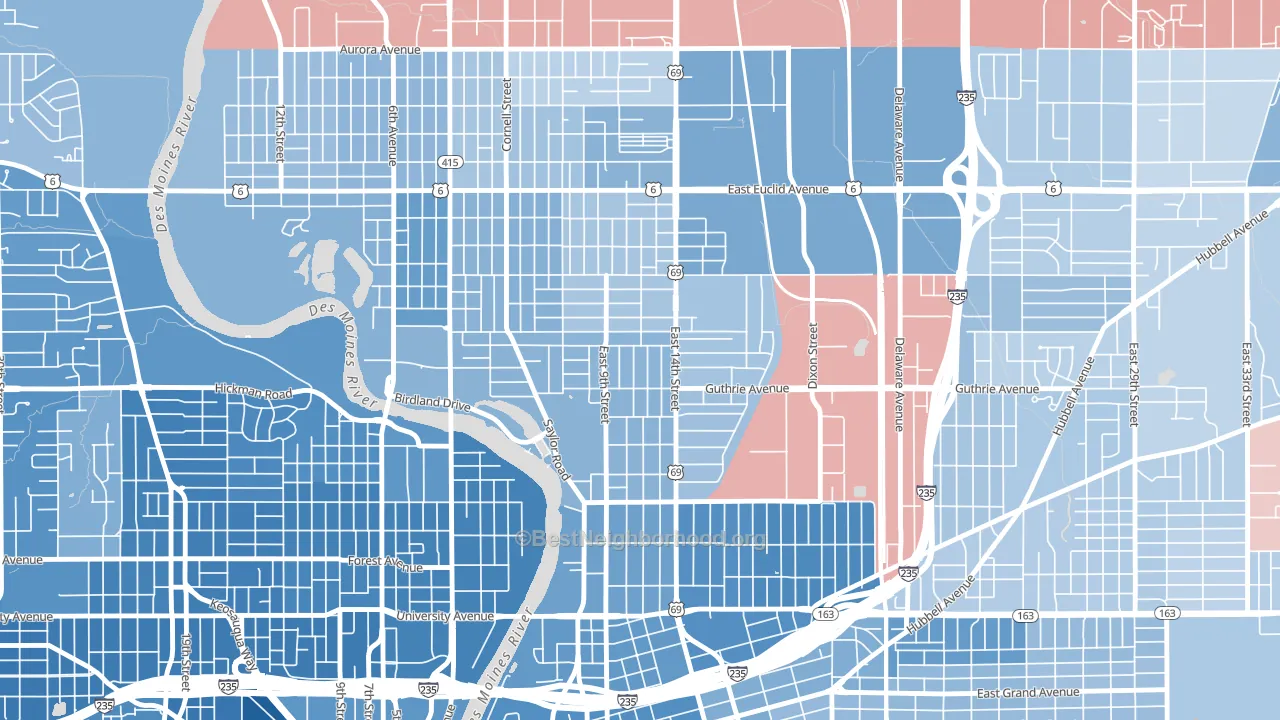
Union Park leans slightly Democratic by roughly 14 points: about 57% of voters vote Democratic and 43% Republican.
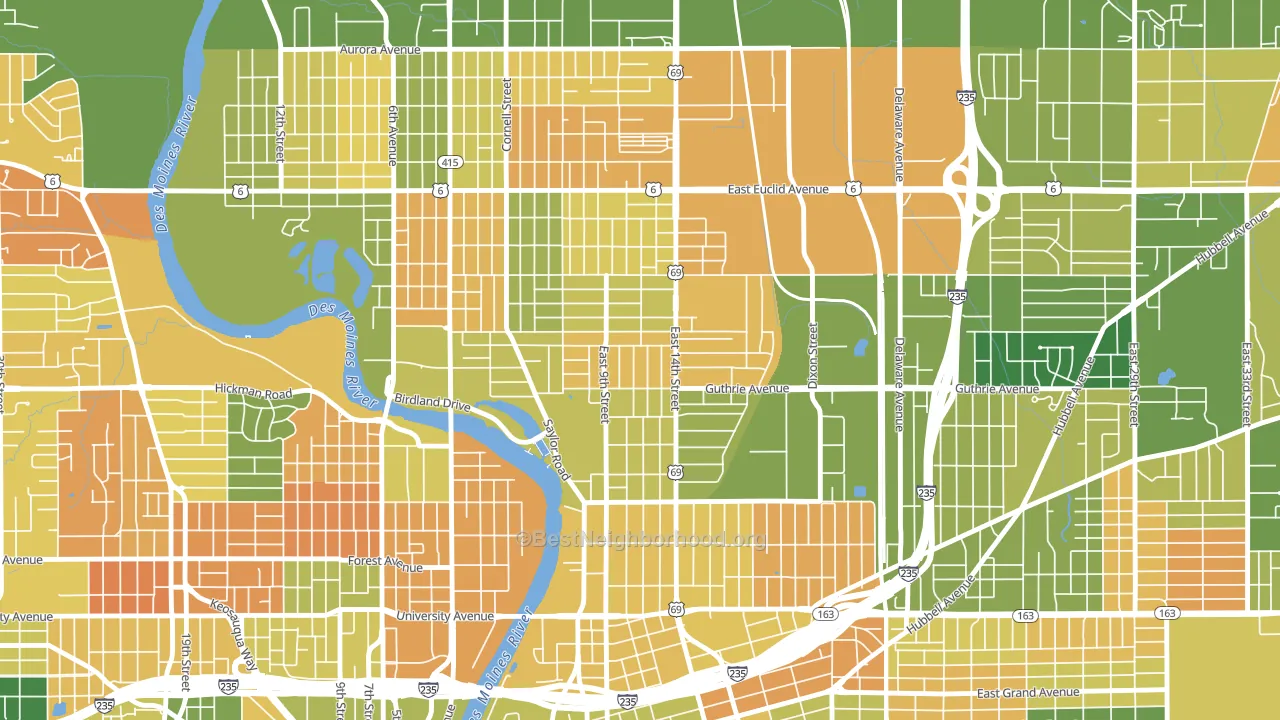
About 49% of adults in Union Park typically vote, below the U.S. average of about 62%. Among adults in Union Park, ~28% vote Democratic, ~21% Republican, and ~51% don't vote. The map below shows estimated turnout by block group.
How Union Park compares
Among neighborhoods within 5 miles, Union Park leans more Democratic than 5 of 17 neighbors.
Union Park runs about 28 points more Democratic than Iowa as a whole. Iowa leans Republican overall, while Union Park is one of the few Democratic-leaning pockets.
Politics vary noticeably by block within Union Park. The northwest side is the most Democratic-leaning (D+25) and the northeast side is the least Democratic-leaning (D+4), a spread of about 21 points.
Why Union Park leans the way it does
This analysis examined 14,881 data points per neighborhood to find what predicts political lean and turnout. The items below are a few correlations that stood out for Union Park, not a ranked or complete list of what matters most.
Union Park votes against the grain of Iowa. Iowa leans Republican overall, while Union Park runs about 28 points more Democratic.
Preventive-care access and voter turnout
Places with limited routine preventive-care access tend to turn out at a lower rate; Union Park, Des Moines, IA sits in the bottom quarter nationally on this measure. Dental visits do not drive turnout; the rate reflects income, insurance, and healthcare access, which line up with who votes.
Why turnout in Union Park looks the way it does
Areas with low high-school completion turn out at lower rates. About 80% of adults in Union Park have completed high school, about 9 points below the U.S. average of 90%. Learn more about the findings and methodology on the political spectrum map.
Nearby Neighborhoods
- Highland Park, Des Moines, IA D+19
- Capitol Park, Des Moines, IA D+33
- River Bend, Des Moines, IA D+45
- Oak Park, Des Moines, IA D+27
- Fairmont Park, Des Moines, IA D+7
- Fairground, Des Moines, IA D+19
- Accent, Des Moines, IA D+9
- Downtown Des Moines, Des Moines, IA D+53
- Douglas Acres, Des Moines, IA D+4
- Drake, Des Moines, IA D+50
Neighborhoods with Similar Populations
- Wellswood, Tampa, FL D+2
- Carquinez Heights, Vallejo, CA D+45
- Royal Highlands, Brooksville, FL R+46
- Crystal Springs, Jacksonville, FL R+3
- Gresham-Kelly Creek, Gresham, OR D+4
- Central Street Merchant District, Evanston, IL D+77
- Euclid-St Paul, St. Petersburg, FL D+18
- Bronze Boot, Phoenix, AZ D+36
- Bird Land, San Diego, CA D+32
- Queensborough, Shreveport, LA D+84
Sources and methodology
Precinct-level voting records used to fit the model come from Iowa Secretary of State, Elections, distributed by the Voting and Election Science Team. Demographic inputs come from the U.S. Census Bureau (ACS 5-year estimates and the 2020 Decennial Census). Health and environmental inputs come from the CDC (PLACES and the Environmental Justice Index). Land cover comes from the USGS and EPA. Election-day and lead-up weather come from PRISM 4km daily grids and the NOAA Global Historical Climatology Network. Mail-voting and election-administration patterns come from the MIT Election Lab's Survey of the Performance of American Elections. Block-group crime detail comes from CrimeGrade. Internet data and modeling support provided by ISPreports.org.
Modeling and analysis by the BestNeighborhood data science team. Full methodology and findings: political spectrum map.
Methodology reviewed by the BestNeighborhood data team. Last updated May 2026.