Royal Highlands leans heavily Republican by roughly 46 points: about 27% of voters vote Democratic and 73% Republican.
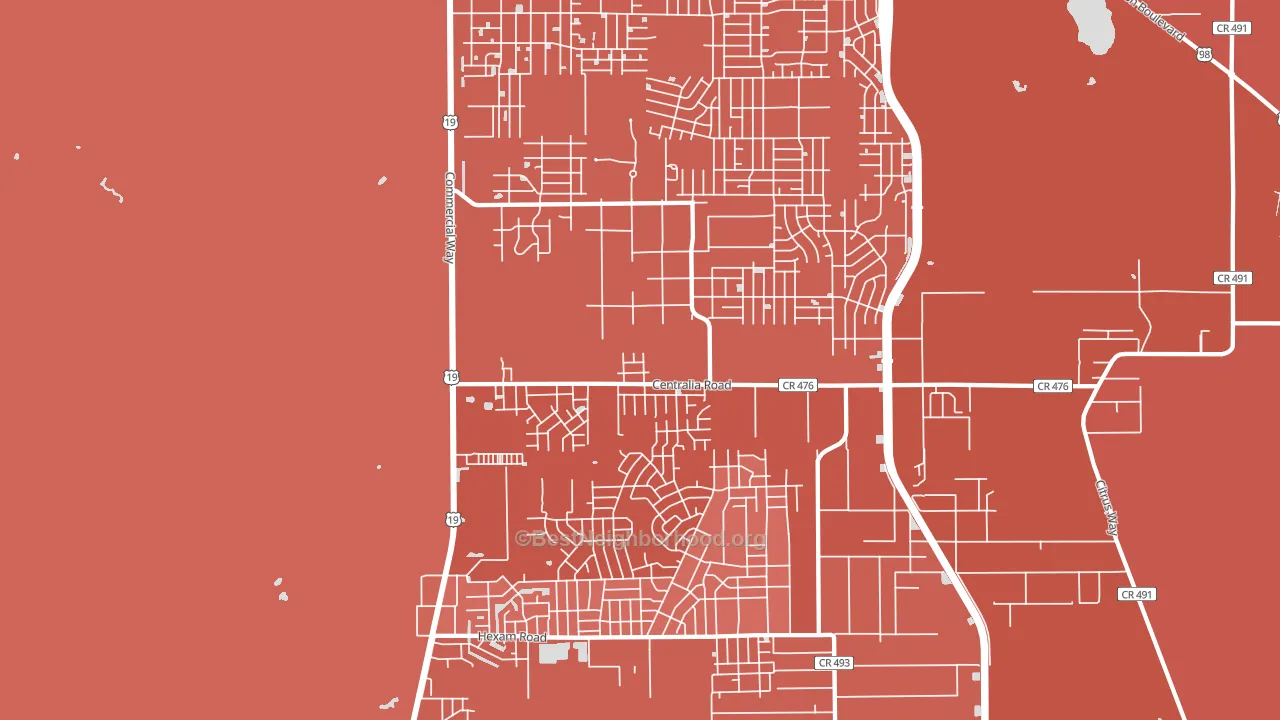
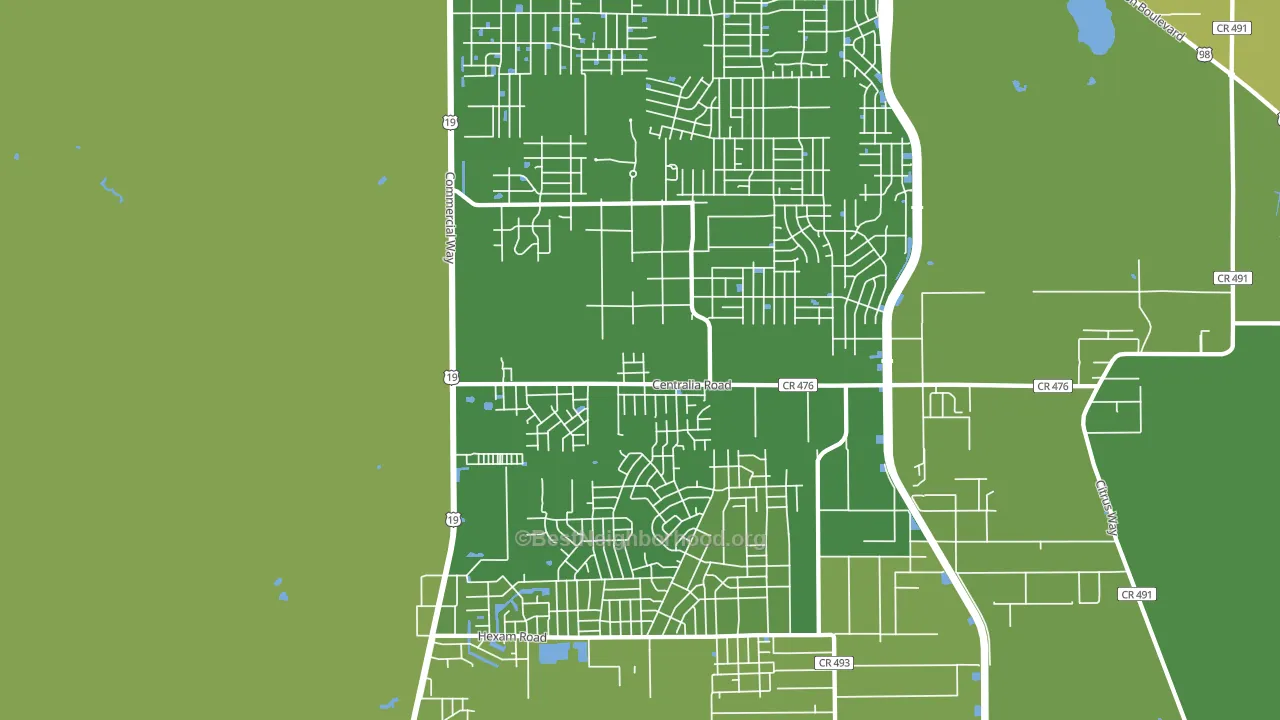
About 93% of adults in Royal Highlands typically vote, above the U.S. average of about 62%. Among adults in Royal Highlands, ~25% vote Democratic, ~68% Republican, and ~7% don't vote. The map below shows estimated turnout by block group.
How Royal Highlands compares
Royal Highlands runs about 33 points more Republican than Florida as a whole.
Why Royal Highlands leans the way it does
This analysis examined 14,881 data points per neighborhood to find what predicts political lean and turnout. The items below are a few correlations that stood out for Royal Highlands, not a ranked or complete list of what matters most.
Areas with many family households vote Republican. About 78% of households in Royal Highlands are family households, about 12 points above the U.S. average of 67%. Rural areas vote Republican, and Royal Highlands sits in the bottom quarter on density (about 70%, below 78% of neighborhoods).
Population density and Republican lean
Places with low population density tend to lean Republican; Royal Highlands, Brooksville, FL sits in the bottom tenth nationally on this measure.
Why turnout in Royal Highlands looks the way it does
Homeowners vote more often than renters. About 96% of households in Royal Highlands own their home, about 25 points above the Florida average of 71%. Learn more about the findings and methodology on the political spectrum map.
Nearby Neighborhoods
- Moon Lake Estates, Moon Lake, FL R+45
- Embassy Hills, Jasmine Estates, FL R+21
- Seven Oaks, Wesley Chapel, FL R+9
- Meadow Point, Wesley Chapel, FL R+5
- West Meadows, Tampa, FL D+15
- New Tampa, Tampa, FL D+14
- Hunters Green, Tampa, FL D+9
- Cory Lake Isles, Tampa, FL Even
- Tampa Palms, Tampa, FL D+16
- Cross Fletcher, University, FL D+35
Neighborhoods with Similar Populations
- Union Park, Des Moines, IA D+15
- Wellswood, Tampa, FL D+2
- Carquinez Heights, Vallejo, CA D+45
- Gresham-Kelly Creek, Gresham, OR D+4
- Crystal Springs, Jacksonville, FL R+3
- Central Street Merchant District, Evanston, IL D+77
- Bird Land, San Diego, CA D+32
- Euclid-St Paul, St. Petersburg, FL D+18
- Bronze Boot, Phoenix, AZ D+36
- Pelican Bay, Naples, FL R+23
Sources and methodology
Precinct-level voting records used to fit the model come from Florida Division of Elections, distributed by the Voting and Election Science Team. Demographic inputs come from the U.S. Census Bureau (ACS 5-year estimates and the 2020 Decennial Census). Health and environmental inputs come from the CDC (PLACES and the Environmental Justice Index). Land cover comes from the USGS and EPA. Election-day and lead-up weather come from PRISM 4km daily grids and the NOAA Global Historical Climatology Network. Mail-voting and election-administration patterns come from the MIT Election Lab's Survey of the Performance of American Elections. Block-group crime detail comes from CrimeGrade. Internet data and modeling support provided by ISPreports.org.
Modeling and analysis by the BestNeighborhood data science team. Full methodology and findings: political spectrum map.
Methodology reviewed by the BestNeighborhood data team. Last updated May 2026.