West Englewood is a Democratic stronghold. About 89% of voters here vote Democratic and 11% Republican.
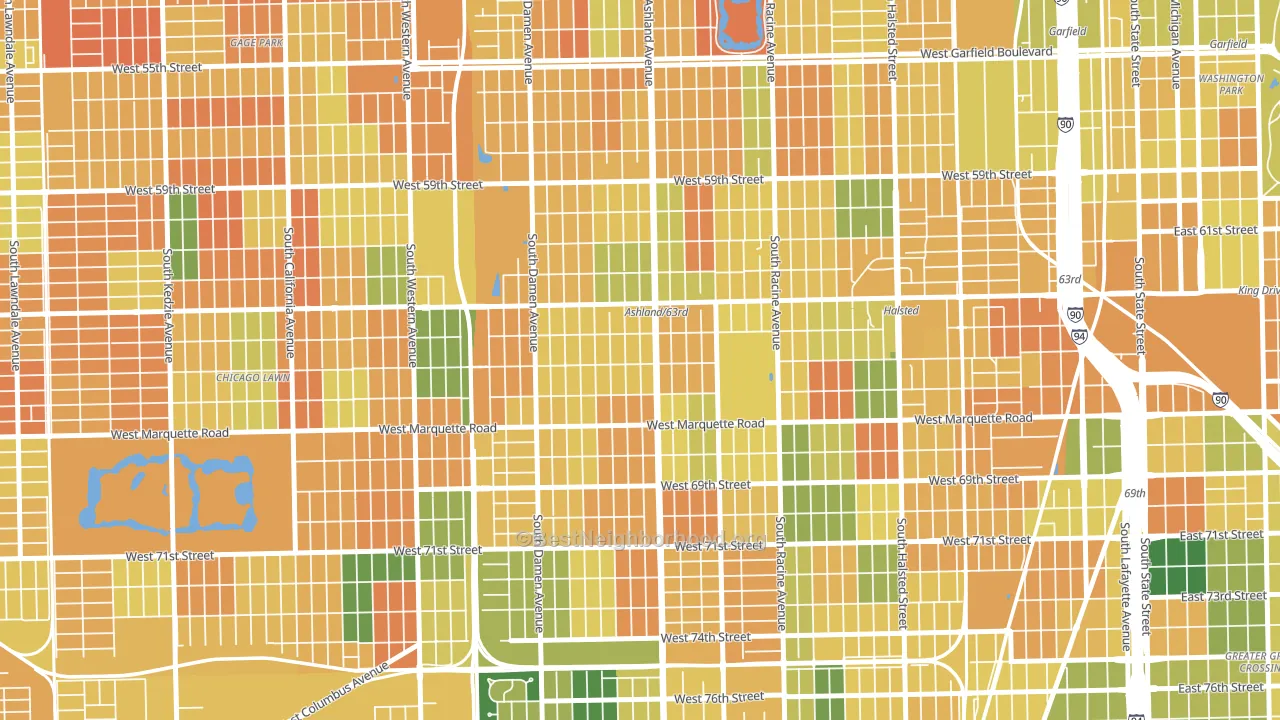
About 43% of adults in West Englewood typically vote, below the U.S. average of about 62%. Among adults in West Englewood, ~38% vote Democratic, ~5% Republican, and ~57% don't vote. The map below shows estimated turnout by block group.
How West Englewood compares
Among neighborhoods within 5 miles, West Englewood leans more Democratic than 21 of 42 neighbors.
West Englewood runs about 68 points more Democratic than Illinois as a whole.
Why West Englewood leans the way it does
This analysis examined 14,881 data points per neighborhood to find what predicts political lean and turnout. The items below are a few correlations that stood out for West Englewood, not a ranked or complete list of what matters most.
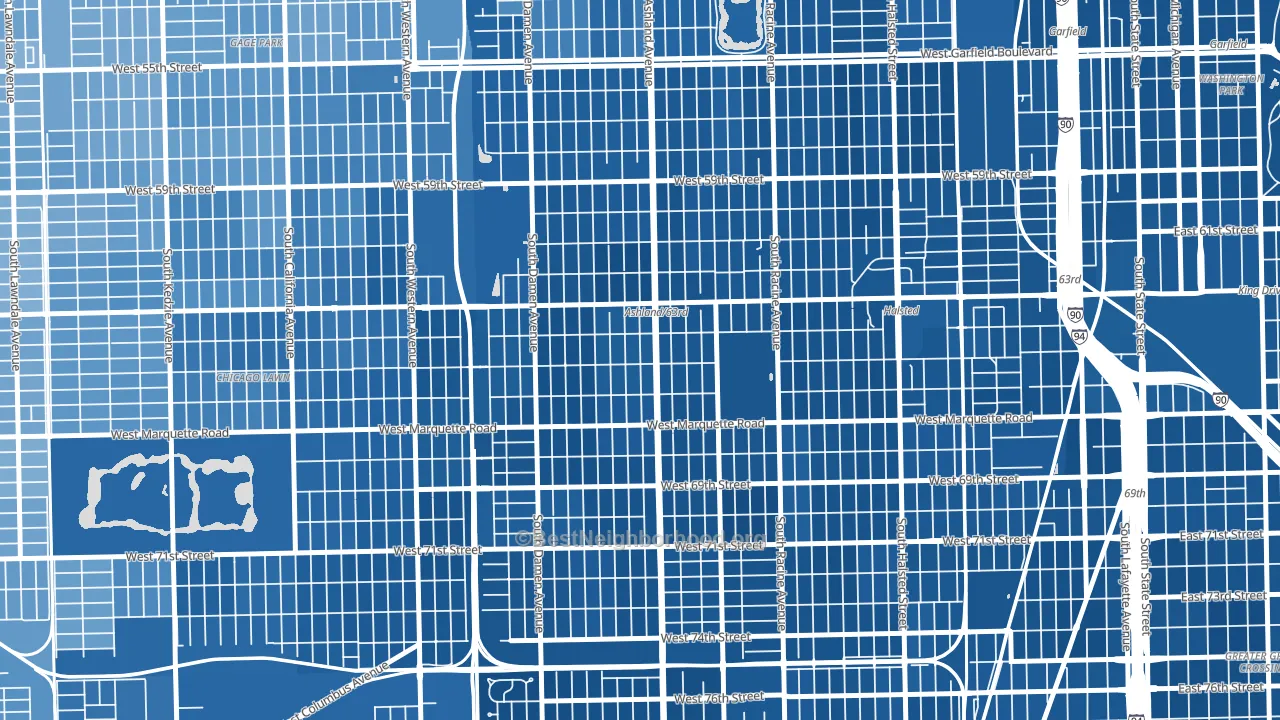
Dense areas vote Democratic. More than 99% of residents in West Englewood live in densely developed areas, about 64 points above the U.S. average of 36%. A high never-married share predicts Democratic voting, and about 54% of adults in West Englewood have never been married, above 87% of neighborhoods.
Population density and Democratic lean
Places with high population density tend to lean Democratic; West Englewood, Chicago, IL sits in the top quarter nationally on this measure.
Why turnout in West Englewood looks the way it does
Areas with limited routine healthcare access turn out at lower rates. West Englewood is in the bottom quarter nationally for routine-care measures such as insurance coverage, preventive screenings, and dental visits. The dental-visit rate here is about 41%, about 22 points below the Illinois average of 63%. High food insecurity lines up with lower turnout, and about 49% of adults in West Englewood report food insecurity, above 98% of neighborhoods. Low high-school completion lines up with lower turnout, and about 77% of adults in West Englewood have completed high school, below 89% of neighborhoods. Learn more about the findings and methodology on the political spectrum map.
Nearby Neighborhoods
- Englewood, Chicago, IL D+80
- Becks Park, Chicago, IL D+80
- Chicago Lawn, Chicago, IL D+58
- New City, Chicago, IL D+54
- Gage Park, Chicago, IL D+39
- South Englewood, Chicago, IL D+83
- Back of the Yards, Chicago, IL D+46
- Auburn Gresham, Chicago, IL D+84
- Auburn Park, Chicago, IL D+82
- Chester Highlands, Chicago, IL D+83
Neighborhoods with Similar Populations
- North Austin, Austin, TX D+48
- Greater Landover, Landover, MD D+78
- Academy Gardens, Philadelphia, PA D+7
- Roxborough, Philadelphia, PA D+40
- Howard Beach, Queens, NY R+29
- North Central Dallas, Carrollton, TX D+8
- Gage Park, Chicago, IL D+39
- South Philadelphia, Philadelphia, PA D+22
- Bridgeport, Chicago, IL D+27
- North End, Tacoma, WA D+58
Sources and methodology
Precinct-level voting records used to fit the model come from Illinois State Board of Elections, distributed by the Voting and Election Science Team. Demographic inputs come from the U.S. Census Bureau (ACS 5-year estimates and the 2020 Decennial Census). Health and environmental inputs come from the CDC (PLACES and the Environmental Justice Index). Land cover comes from the USGS and EPA. Election-day and lead-up weather come from PRISM 4km daily grids and the NOAA Global Historical Climatology Network. Mail-voting and election-administration patterns come from the MIT Election Lab's Survey of the Performance of American Elections. Block-group crime detail comes from CrimeGrade. Internet data and modeling support provided by ISPreports.org.
Modeling and analysis by the BestNeighborhood data science team. Full methodology and findings: political spectrum map.
Methodology reviewed by the BestNeighborhood data team. Last updated May 2026.